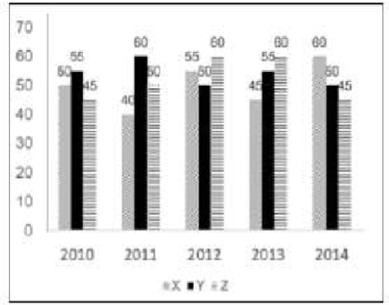
The graph shows the production of tyres (in Lakhs) by three different companies X. Y, and Z over the years Directions: Study the following graph carefully to answer the question given below it. What is the difference between the average production per year of the company with the highest average production and that of the company with the lowest average production in Lakhs? SSC MTS 2021-01.09.2023-1
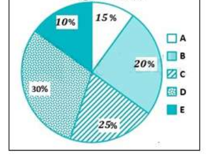
Study the given pie-chart and answer the question that follows. The pie-chart shows the percentage of the population in five villages in a year. Total Population of five villages = 50,000. Find the ratio of population in villages B and D. SSC MTS 2021-01.09.2023-2
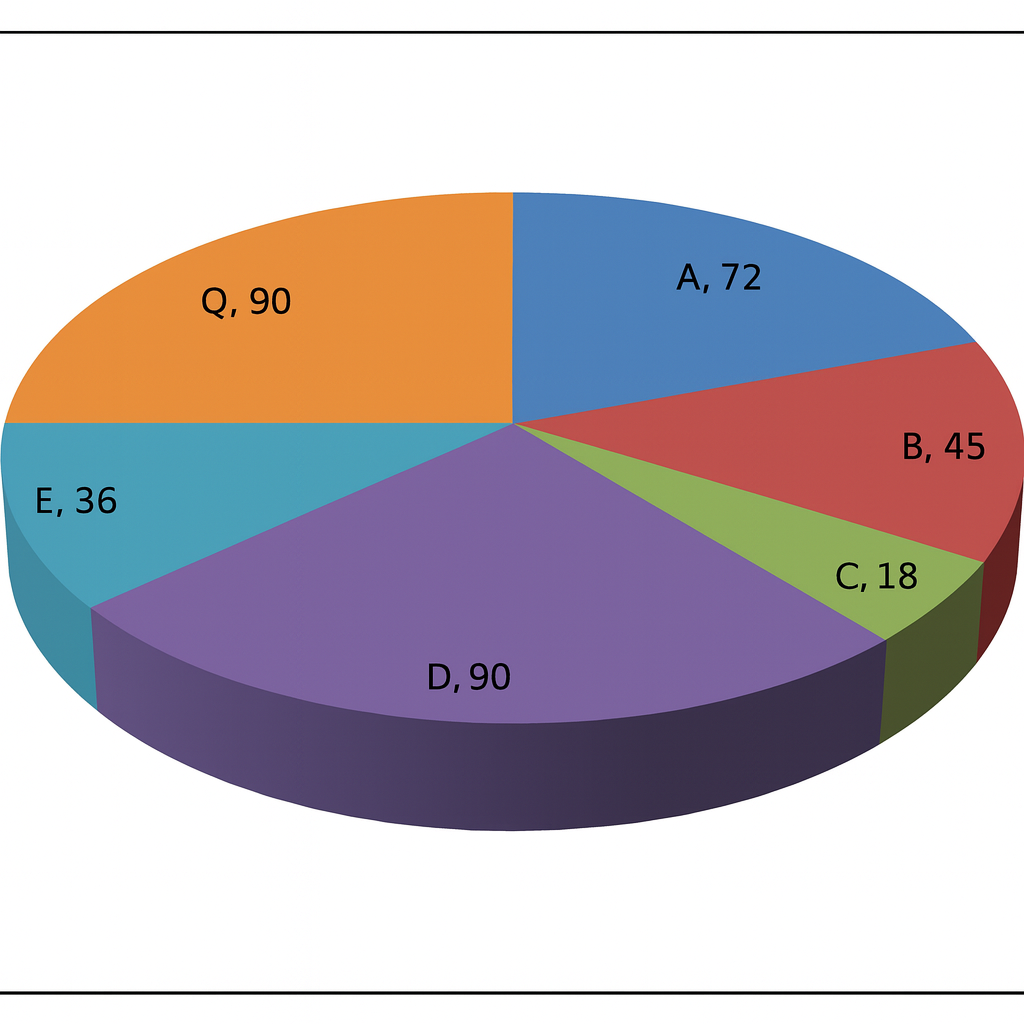
The pie diagram represents the export of different types of fabrics (in degree measure) from India during 2015. If the income from one ton of fabric A is three times that from fabric C, then the ratio between the income from A to C is : SSC MTS 2021-01.09.2023-2
The following table indicates the number of candidates who appeared in an entrance examination from four different cities A, B, C. D and the ratio of passing and failing. Stuty the table carefully and answer the question.
City
No. of candidates appeared
Ratio of passing and failing
A
660
5 : 6
B
650
2 : 3
C
500
3 : 2
D
630
4 : 5
Which city has the highest number of candidates who failed in the entrance examination and find its rate of percent in the city,respectively? SSC MTS 2021-01.09.2023-1
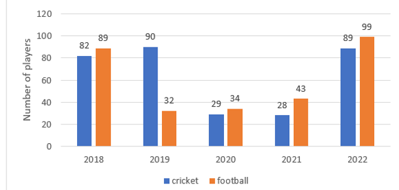
The bar graph shows the number of players of a college taking part in two games for five years: What is the total number of players playing cricket and football in 2019 and 2020? SSC MTS 2021-04.09.2023-1