The given histogram represents the marks of students in Maths test of a certain class.
The total number of students is 350.
Study the graph and answer the questions that follow.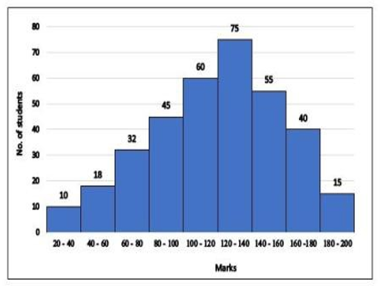
What is the ratio of the total number of students who scored 140 marks and above to the total number of students who scored marks between 60 and 120?
The angle of elevation of the top of an unfinished tower at a point distant 78m from its base is 30°. How much higher must the tower be raised (in m) so that the angle of elevation of the top of the finished tower at the same point will be 60°?
Find the value of the following expression:
372 ÷ 56 × 7 - 5 + 2
58
\(-2 \dfrac{95}{98}\)
\(43 \dfrac{1}{2}\)
\(2 \dfrac{93}{98}\)
LCM of two numbers is 56 times their HCF, with the sum of their HCF and LCM being 1710. If one of the two numbers is 240, what is the other number?
General English
Select the option that expresses the given sentence in passive voice. She handles all tasks efficiently.
All tasks are being handled efficiently by her.
All tasks were handled efficiently by her.
All tasks have been handled efficiently by her.
All tasks are handled efficiently by her.
Select the most appropriate option that can substitute the underlined segment in the given sentence. If there is no need to substitute it, select 'No substitution required'.
The authorities are assured the people that they will look into the matter.
has assured
have assured
have been assured
No substitution required