Quantitative Aptitude
A pole 23 m long reaches a window which is 3\(\sqrt{5}\) m above the ground on one side of a street. Keeping its foot at the same point, the pole is turned to the other side of the street to reach a window 4\(\sqrt{15}\) m high. What is the width (in m) of the street?
Study the given bar graph and answer the question that follows.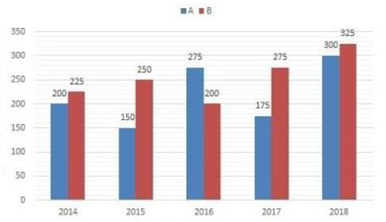
The bar graph shows the exports of cars of type A and B (in Rs. millions) from 2014 to 2018.
In which year were the exports of cars of type A Rs. 55 million less than the average exports (per year) of cars of type B over the five years?
What is the height (in cm) of an equilateral triangle whose each side is 8 cm?
A vertical pole and a vertical tower are on the same level of ground in such a way that from the top of the pole, the angle of elevation of the top of the tower is 60º and the angle of depression of the bottom of the tower is 30º. If the height of the tower is 76 m, then find the height (in m) of the pole.
The given bar graph shows export of cars of type A and B(in Rs. millions) from 2014 to 2018. Study the graph and answer the question that follows.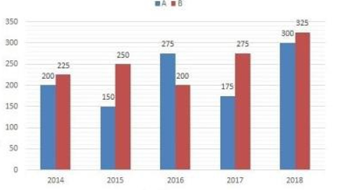
Exports of Cars of Type A and B (in Rs. millions) from 2014 to 2018.
The total exports of cars of type B in 2014 to 2017 is what per cent more than the total exports of cars of type A in 2015 to 2018? (correct to one decimal place)
Simplify the following expression:
-(a + 2b) (b +2c) (4c + a)
2(a + 2b) (b + 2c) (4c + a)
4(a + 2b) (b + 2c) (4c + a)
(a + 2b) (b + 2c) (4c + a)
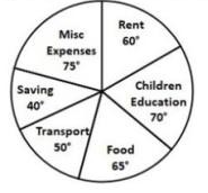
Monthly expenditure of a family on different heads is shown in the following pie chart. The family earns Rs. 1,08,000 every month.
The money (in Rs.) spent on Misc. Expenses is how much more than that spent on Children Education?