Quantitative Aptitude
Performance of 1800 students in grades has been shown in the following pie chart.
In which two grades taken together is the number of students 54 less than the number of students in grades B and E taken together?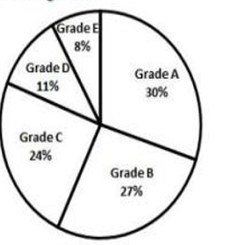
The average of 52, 71, 43, 22, a, and b is 55 and the average of 42, 45, 49, 51, 42, c, and d is 53. What is the average of a, b, c, and d?
The following bar graph shows the total number of youth (in lakhs) and the number of employed youth (in lakhs) in 5 states A,B,C,D,E.
Which state has the maximum number of unemployed youth?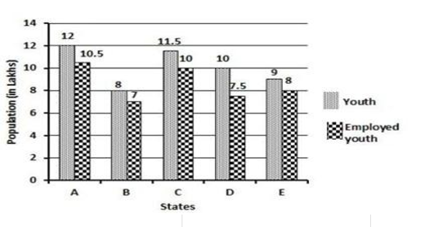
If x = 4 + √15, what is the value of \( \left(x^{2} + \frac{1}{x^{2}}\right) \)
A person sold an article at a loss of 18%. Had he sold it for Rs.960 more, he would have gained 12%. If the article is sold for Rs.3840, then how much is the profit percentage?
In ΔLMN, the bisectors of ∠L and ∠N intersect at an angle of 112°. What is the measure (in degrees) of ∠M?
A boatman can row his boat in still water at a speed of 9 km/h. He can also row 44 km downstream and 35 km upstream in 9 hours. How much time (in hours) will he take to row 33 km downstream and 28 km upstream?
In ΔACD, B and E are two points on side AC and AD respectively, such that BE is parallel to CD. CD = 9 cm. BE = 6cm, AB = 5 cm and ED = 2 cm. What are the measures of the lengths (in cm) of AE and BC?
The reduction of 15% in the price of salt enables a person to buy 2 kg more for ₹272. The reduced price of salt per kg is