Quantitative Aptitude
Find the value of 703 + 203 - 903 .
On simple interest, a certain sum becomes Rs.59,200 in 6 years and Rs.72,000 in 10 years. If the rate of interest had been 2% more, then in how many years would the sum have become Rs.76,000 ?
The given bar graph shows the exports of cars of type A and B (in millions) from 2014 to 2018. Study the graph and answer the question that follows.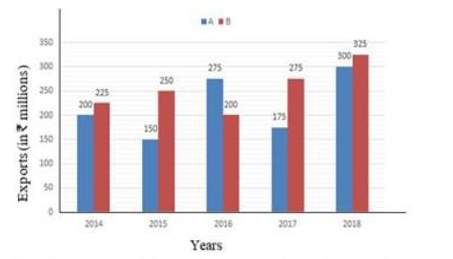
What is the ratio of the total exports of cars of rune A in 2014 and 2018 to the total exorts of cars of type B in 2015 and 2017?
Monthly expenditure of a family on different heads is shown in the following chart.
What is the percentage of family earnings spent on rent?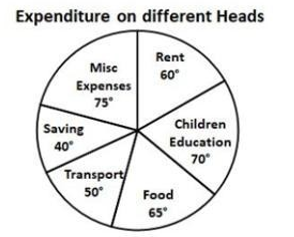
The difference berween the two perpendicular sides of a right-angled triangle is 17 cm and its area is 84 cm2, What is the perimeter (in cm) of the triangle?
Find the value of the following expression:
\[ \frac{5 - 35 \div 5 \times 15 + 5}{12 - 2} \]
The price of petrol shot up by 5%. Before the hike, the price was Rs.82 per litre. A man travels 3045 km every month and his car gives a mileage of 15 km per litre. What is the lncrease in the monthly expenditure (to the nearest ₹) on the man's travel due to the hike in the petrol prices?
A trader sells an article for Rs.425 and loses 15%. At what price (in ₹) should he sell the article to earn 5% profit?
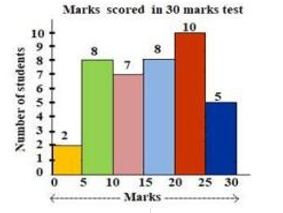
The following histogram shows the marks scored by 40 students in a test of 30 marks. A student has to score a minimum of 10 marks to pass the test.
How many students have scored less than two-third of the total marks?