Quantitative Aptitude
The given histogram represents the marks of students in Mathematics test of a certain class. The total number of students is 350 and the maximum marks of the test are 200.
Study the graph and answer the question that follows.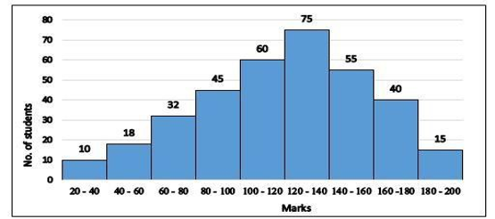
What is the class average (correct up to one place of decimal) of mathematics test?
A and B start a business. A invests \(33\dfrac{1}{3}\)% of the total capital and B invests the remaining. If the total profit at the end of the year is ₹1,62,000, then B's share (in ₹) is:
A shopkeeper marks his goods at a price 20% higher than their cost price and allows 10% discount on every item. Find his gain percentage.
The following bar graph shows the number of youth (in lakhs) and the number of employed youth (in lakhs) in 5 states A, B, C, D and E.
In which state(s) is the number of youth more than the average number of youth in the five states?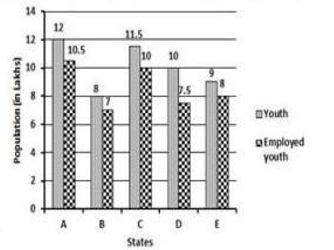
The angle of elevation of the top of a tall building from the points M and N at the distance of 72m and 128m respectively, from the base of the building and in the same straight line with it, are complementary. The height of the building (in m) is:
The simple interest on a certain sum is one-eighth of the sum when the number of years is equal to half of the rate percentage per annum. Find the simple interest (in ₹) on ₹15,000 at the same rate of simple interest for 8 years.