Chords AB and CD of a circle intersect externally at P. If AB = 7 cm, CD = 1 cm and PD = 5 cm, then the length of PB (in cm) is:
In ΔABC, AB = 7 cm, BC = 10 cm, and AC = 8 cm. If AD is the angle bisector of ∠BAC, where D is a point on BC, then DC (in cm) =?
\( \frac{14}{3} \)
\( \frac{16}{3} \)
\( \frac{11}{3} \)
\( \frac{17}{3} \)
A sum of 4,620 is to be paid back in 2 equal annual instalments. How much is each instalment (in ₹) if the interest is compounded annually at 10% per annum?
Study the pie chart and answer the questions that follow.
The pie chart represents the percentage-wise distribution of the total number of Vanilla cakes and Chocolate cakes sold every day in a week. The total number of cakes sold in a week = 10500.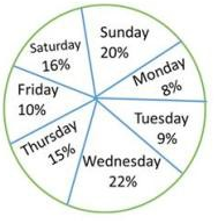
The ratio of the number of Vanilla cakes sold to the number of Chocolate cakes sold on Saturday is 4:3, the selling price of one Vanilla cake is ₹8 and that of one Chocolate cake is ₹15, then the total amount earned (in ₹) by selling all Vanilla cakes and Chocolate cakes on Saturday is:
In the given figure, O is the centre of the circle. ∠POQ = 54º. What is the measure (in degree) of ∠PRQ?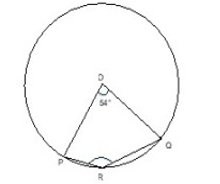
A train covers a distance of 225 km in \(2\dfrac{1}{2}\)half hours at a uniform speed. The time taken by the train (in hours) to cover a distance of 630 km at the same speed is