The following pie charts show the number of students studying in different departments of an institution during the academic years 2019 and 2020. The total number of students was 2000 and 2400 in the yeras 2019 and 2020 respectively.
Students studying humanities in 2019 and 2020 taken together is what percentage of the total number of students studying during the two years taken together? (correct to 2 decimal places)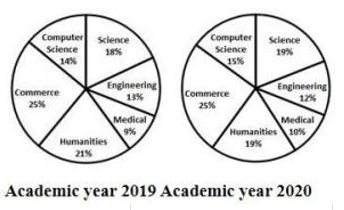
A man started off a business with a certain capital amount. In the first year, he earned 60% profit and donated 50% of the total capital (initial amount + profit). He followed the same procedure with the remaining capital after the second and the third year. If at the end of the three years, he is left with ₹15,360, what was the initial amount (in ₹) with which the man started his business?
Study the bar graph and answer the question that follows.
The bar graph shows the exports of car type A and B from 2014 to 2018.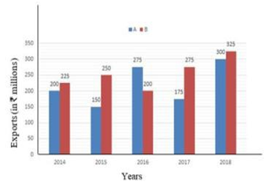
What is the ratio of the total exports of cars of type A in 2016 and 2018 to the total exports of cars of type B in 2014 and 2017?
The number of cars passing the road near a colony from 6am to 12noon has been shown in the following histogram.
What is the maximum change (percentage) in the number of cars as compared to the previous hour? (correct to 2 decimal places)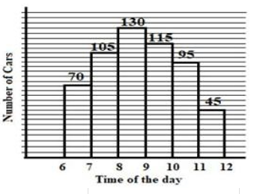
Decrease of 52.63%
Decrease of 58.5%
Increase of 55.56%
Increase of 58.5%
If A = 60°, then what is the value of
\[
\frac{10\sin\frac{A}{2} + 8\cos A}{7\sin\frac{3A}{2} - 12\cos A}
\]
If 3 sin²θ + 4 cosθ - 4 = 0, 0° < θ < 90°, then the value of (cosec²θ + cot²θ) is
\(\dfrac{5}{4}\)
\(\dfrac{25}{3}\)
\(\dfrac{4}{3}\)
\(\dfrac{17}{9}\)
A vegetable vendor supplies vegetables to a housing complex of 50 families. On a particular day, the break-up sale of vegetables is represented in the form of a pie chart as shown.
Study the pie chart carefully and answer the question that follows.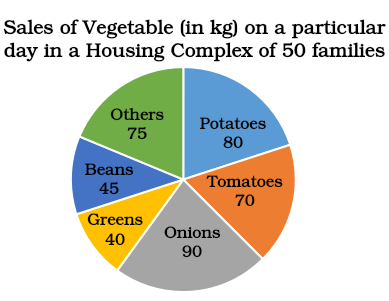
What is the ratio of the central angle corresponding to the sale of potatoes, tomatoes and beans together to the central angle corresponding to the combined sale of onions and others?
What is the value of
\(\dfrac{30}{79}\)
\(\dfrac{42}{79}\)
\(\dfrac{36}{79}\)
\(\dfrac{24}{79}\)