The following bar graph shows receipts and expenditure of a business firm over 5 years.
Gain = Receipts - Expenditure.
What is the percentage of increase in expenditure from 2018 to 2019 as compared to 2018?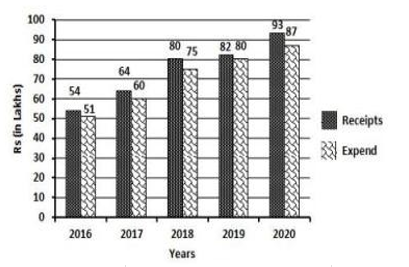
\(6\dfrac{1}{4}\)
\(8\dfrac{3}{4}\)
\(2\dfrac{1}{2}\)
\(6\dfrac{2}{3}\)
The given histogram shows the height of 232 students of an athletic club and their numbers.
Study the histogram carefully and answer the question that follows.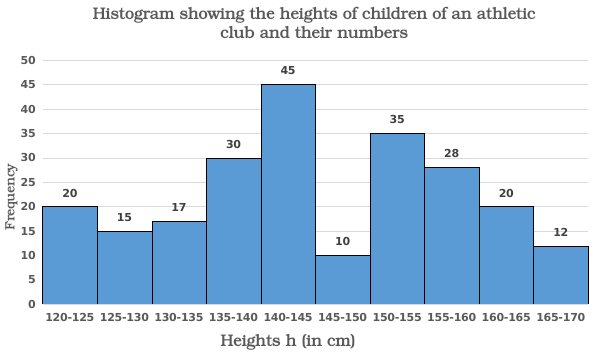
If the histogram is to be presented by a line diagram, what would be the starting point and the end point of the line diagram?
(122.5, 20) and (167.5, 20)
(117.5, 0) and (172.5, 0)
(117.5, 20) and (172.5, 20)
(122.5, 0) and (167.5, 0)
AB is a chord in the minor segment of a circle with centre O. C is a point between A and B on the minor arc AB. The tangents to the circle at A and B meet at the point D. If ∠ACB = 116°, then the measure of ∠ADB is:
Study the bar graph and answer the questions that follows.
The bar graph shows the exports of cars of type A and B ( in millions) from 2014 to 2018.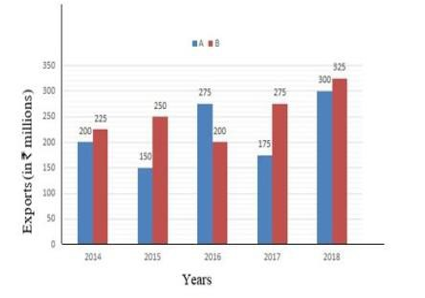
In which year were the exports of cars of type B ₹20 million less than the average exports (per year) of cars of type A over the five years?
A fruit vendor recovers the cost of 95 oranges by selling 80 oranges. What is his profit percentage?