If 5\(\sqrt{3}\) + \(\sqrt{75}\) = 17.32, then the value of 14\(\sqrt{3}\)+ \(\sqrt{108}\) is:
The number of cars passing the road near a colony from 6 am to 12 noon has been shown in the following histogram.
During which hour(s) is the number of cars passed less than the average number of cars passed from 7 am to 12 noon?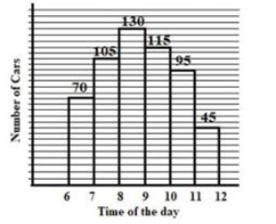
A and B can do a work in 12 days and 18 days, respectively. They worked together for 4 days after which B was replaced by C and the remaining work was completed by A and C in the next 4 days. In how many days will C alone complete 50% of the same work?
The given bar graph shows the income and expenditure of a company over 5 years from 2014 to 2018. Study the bar graph and answer the question that follows.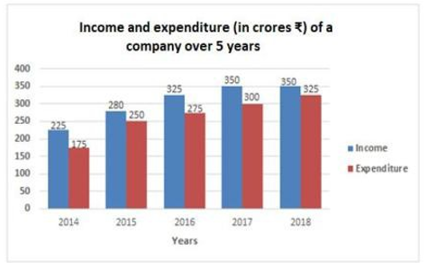
What is the difference (in crores Rs.) between the expenditure for the year 2017 and 2018 taken together and the income for the years 2015 and 2016 taken together?
The following bar graph shows the number of youth (in lakhs) and the number of employed youth (in lakhs) in five states A,B,C,D,E.
What is the average number of youth in the five states?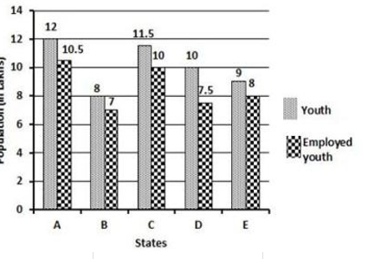
The value of \(\left(\frac{1 - \cot \theta}{1 - \tan \theta}\right)^{2} + 1\) If 0° < θ < 90°,is equal to:
An article is sold at a certain price. If it is sold at 70% of this price, then there is a loss of 10%. What is the percentage profit, when it is sold at the original selling price?
\( \frac{50}{7} \)%
\( \frac{200}{7} \)%
\( \frac{300}{7} \)%
\( \frac{100}{7} \)%
The length of the body diagonal of a cube is 8\(\sqrt{2}\) cm. What is the volume (in cm³) of the cube?