In ΔABC, if ∠A = 90°, AC = 5 cm, BC = 9 cm and in ΔPQR, ∠P = 90°, PR = 3 cm, QR = 8 cm, then:
The following diagram shows the rainfall over two years. Which of the following months shows the highest percentage change in rainfall?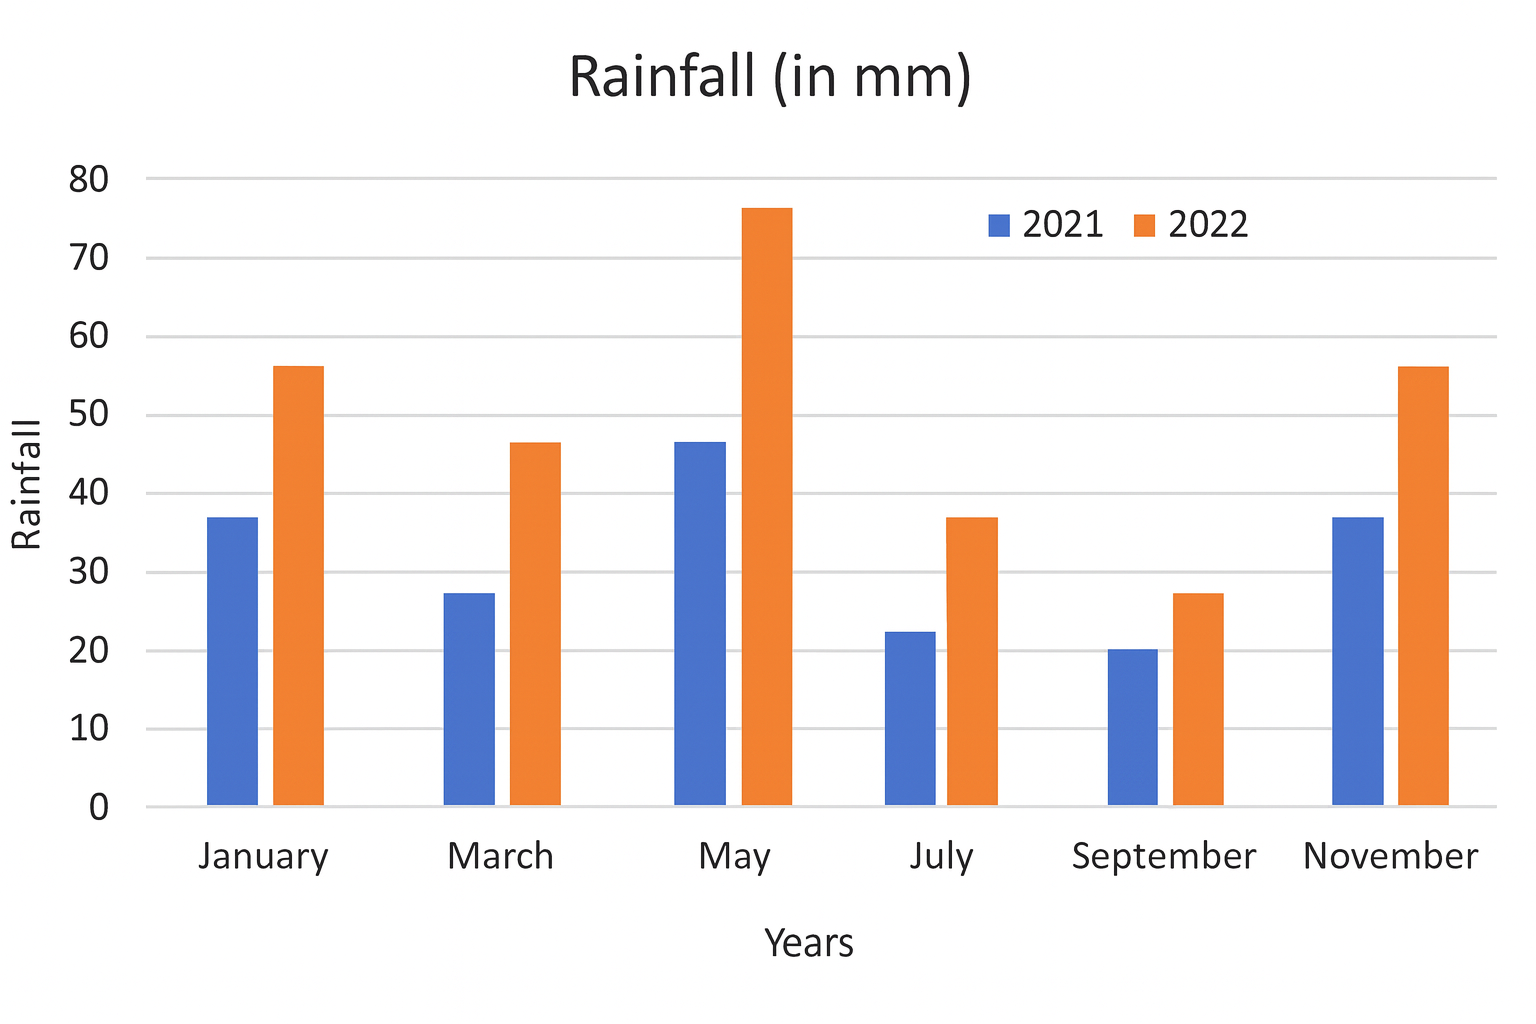
If \(
p = \frac{\sqrt{2} + 1}{\sqrt{2} - 1} \quad \text{and} \quad q = \frac{\sqrt{2} - 1}{\sqrt{2} + 1}
\) then find the value of \(
\frac{p^2}{q} + \frac{q^2}{p} \)
Observe the given figure. The distance between the two centers AB is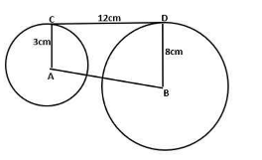
Quantity of various food items used by a restaurant during 4 months of a year (in kg).
| Food Item |
Month
|
|||
| March | April | May | June | |
| A | 220 | 180 | 270 | 320 |
| B | 255 | 320 | 390 | 420 |
| C | 280 | 295 | 280 | 315 |
| D | 350 | 310 | 250 | 280 |
| E | 308 | 340 | 350 | 365 |
What is the average quantity of food item C used during all the 4 months together?
Simplify the following expression.
\(
\frac{7}{10} \div \frac{3}{7} \text{ of } \left( 2 \tfrac{3}{10} + 2 \tfrac{3}{5} \right)
+ \frac{1}{5} \div 1 \tfrac{2}{5} - \frac{2}{7}
\)
-\( \frac{4}{21} \)
\( \frac{5}{21} \)
\( \frac{4}{21} \)
-\( \frac{5}{21} \)
Using tan(A - B) = \( \frac{tanA - tanB}{1 + tanA tanB'} \) find the value of tan 15°
\(\sqrt{3}\) + 1
\(\sqrt{3}\) - 1
2 - \(\sqrt{3}\)
2 + \(\sqrt{3}\)