Section : Quantitative Aptitude
The value of \(\frac{5}{4} \times 2\frac{2}{3} \div \frac{5}{9} \text{ of } 1\frac{1}{5} + \frac{2}{25} \times 4\frac{1}{6} \div \frac{2}{7} \text{ of } 2\frac{1}{3}\) is:
\(5\frac{1}{2}\)
\(3\frac{1}{2}\)
\(2\frac{1}{2}\)
\(1\frac{1}{2}\)
If x + y + z = 13, x2 + y2 + z2 = 91 and xz = y2 ,then the difference between z and x is:
Study the given graph and answer the question that follows.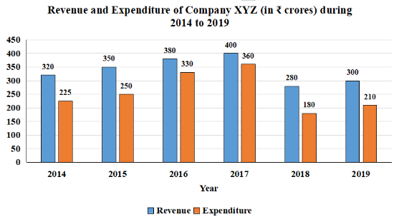
The total revenue of the company in 2014, 2016 and 2018 is what percentage of the total expenditure in 2015 to 2017 and 2019 (correct to one decimal place)?
Study the given pie-charts and answer the question that follows.
The pie charts represent the popularity of ice-cream flavours among families in the years 2019 and 2020.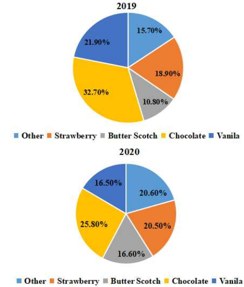
If 1% increase resulted in annual additional sales of ₹10,000, then how much (in ₹), did the combined Strawberry, Other and Butterscotch sales increase from 2019 to 2020?
The simple interest on a sum of ₹8,000 at a certain rate per cent per annum for 3 years is ₹3,600. What will be the amount (in ₹) of the same sum after 2 years at the same rate, if the interest is compounded 8-monthly?