Study the given pie charts and answer the question that follows.
The pie charts represent the distribution of candidates who were enrolled for Bank Clerical Examination Fig (i) and the candidates(out of those enrolled) who passed the examination Fig(ii) in five different institutes P, Q, R, S and T.
(I) Total number of candidates enrolled in five different institutes = 5500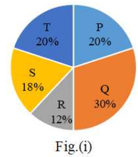
(I) Total number of candidates who passed the examination from five institutes = 3300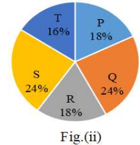
The percentage of the candidates who passed to the number of candidates enrolled for institutes P and T together is
Study the given bar graph and answer the question that follows.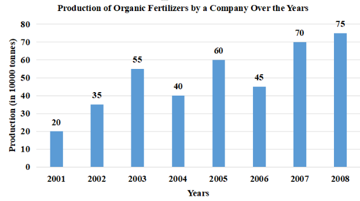
In which year was the percentage increase in production as compared to the previous year, the maximum?
X sells an article to Y at 12% loss. Y sells it to Z at 9% profit. If Z pays ₹21,582 for it, then at what price (in ₹) was the article purchased by X?
If (3x + 2y)3 + (3x - 2y)3 = 3kx(3x2 + 4y2), then the value of k will be:
The value of \(42 \times 10^{- \left( \frac{7 \times 1}{4^3} \right)^{ \frac{6}{5} } + \frac{16 \times 9}{10} - \left( \frac{1}{6} - \frac{1}{36} \right)}\)is
If 27x3 - 64y3 = (Ax + By) (Cx2 + Dy2 - Exy), then value of (A - B + C - D + E) will be:
Study the given graph and answer the question that follows.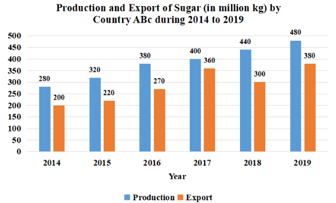
For which of the following years was the increase in the production of sugar as compared to that in its preceding year between 8% and 10%?