Section : Quantitative Aptitude
If x4 + x-4 = 47, x > 0, then the value of (2x - 3)2 is:
The value of \(\dfrac{\sec\theta \cosec\theta}{2+\tan^{2}\theta+\cot^{2}\theta}\) is equal to:
When an article is sold for ₹438,there is a loss of 27%. To gain 23%, it should be sold for ₹x . What is the value of x ?
Study the table and answer the question that follows:
In the given table, production of five different types of machines (A, B, C, D, E) in the years from 2016 to 2020 (in thousands) is given.
| Machines | Years | ||||
| 2016 | 2017 | 2018 | 2019 | 2020 | |
| A | 46 | 53 | 56 | 58 | 67 |
| B | 50 | 65 | 67 | 66 | 72 |
| C | 43 | 54 | 55 | 47 | 51 |
| D | 47 | 52 | 61 | 65 | 74 |
| E | 48 | 58 | 63 | 64 | 67 |
What is the ratio of the total production of type A machines in 2018 and type E machines in 2019 to the total production of type C and type D machines in 2016?
Study the given bar graph and answer the question that follows.
The bar graph indicates the production of sugar (in lakh tonnes) by three different sugar companies P, Q and R over the years 2015 to 2019.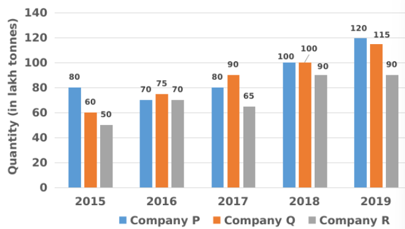
By what percentage is the total production of sugar by company P from the year 2015 to 2019 more than the total production of sugar by company R from the year 2015 to 2019?
If a2 + b2 + c2 + 48 = 8(a + b + c), then what is the value of \(\sqrt[3]{a^3 - b^3 + c^3}\) ?
The difference between the simple interest on a fixed amount for 7 years and on the same amount for 12 years is ₹2,500. If the rate of interest is 10% p.a., then the amount is: