Varun and Gaurav can dig a pond in 10 days and 18 days, respectively. After finishing that work together, they receive an amount of ₹7,280. What is the share of Gaurav in that amount?
Ram sold plot for ₹6,55,000 at 20% loss. For what price should he sell the plot to gain 15% profit ?
Study the given pie-chart and answer the question that follows.
The pie-chart represents the percentage distribution of candidates qualified in a bank examination from six different districts of a State in 2016. The total number of qualified candidates from the State is 68000.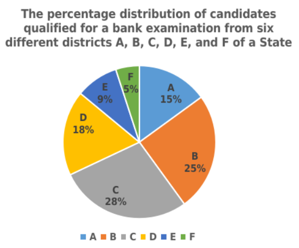
What is the difference (to the nearest whole number) between the average number of qualified students from the Districts A, C and F and the average number of qualified students from the Districts B, D and E?
Pawan travels from X to Y at the speed of 10 km/h, from Y to Z at 15 km/h and from Z to W at 20 km/h. If XY = YZ = ZW (in km), then the average speed of Pawan for the whole journey is:
\(13\tfrac{10}{13}\,\text{km/h}\)
\(13\tfrac{11}{13}\,\text{km/h}\)
\(13\tfrac{8}{13}\,\text{km/h}\)
\(13\tfrac{9}{13}\,\text{km/h}\)
The value of \(364 - \left[142 - \left\{75 + \left(38 - \tfrac{5}{4} + \tfrac{14}{8}\right)\right\}\right]\) is:
If sin α + cosec α = \(\tan \frac{\pi}{3}\) , then the value of (sin3 α + cosec3 α) is equal to:
Study the given pie chart and table and answer the question that follows.
The pie chart represents the percentage wise distribution of 300 students of class X in a school in six different sections A, B, C, D, E and F.
The table shows the number of boys of class X in six different sections A, B, C, D, E and F.
| Section | A | B | C | D | E | F |
| No. of boys | 36 | 26 | 34 | 28 | 20 |
If the total number of students in section C is 57, then the total number of girls in section C and D together will be: