Study the given pie chart and answer the question that follows.
The pie chart shows the distribution (degree wise) of the number of computers sold by a shopkeeper during five months.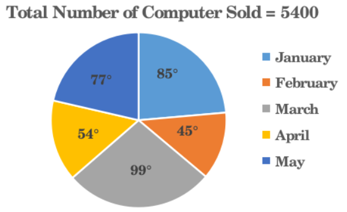
If the difference between the number of computers sold in May and the number of computers sold in February is x, then the value of x will be:
If the five-digit number 457ab is divisible by 3, 7 and 11, then what is the value of a2 + b2 + ab?
If tanθ + cotθ = 3, then what will be the value of tan2θ + cot2θ ?