Section : Quantitative Aptitude
Study the given pie chart and answer the question that follows.
The pie chart represents the popularity of ice-cream flavours among families in the year 2019.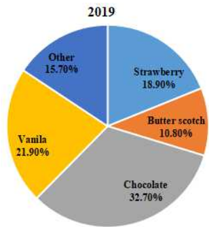
In 2019, if 20% of the ‘Other’ category was Anjeer flavour and 4082 people preferred Anjeer flavour, then how many people were surveyed?
If θ is an acute angle and sinθ = cosθ, then the value of 2tan2 θ + sin2 θ - 1 is equal to:
Rakesh sold a car for ₹5,00,000 at a 28% profit. At what price should he sell it to get a 32% profit?
If x + y + z = 5, \(\dfrac{1}{x} + \dfrac{1}{y} + \dfrac{1}{z}\)= 0, xyz = 12 and x3 + y3 + z3 =151, then the value of ( x2 + y2 + z2) is:
Study the graph and answer the question that follows.
The given chart represents the demand and production of leather bags of five companies U, V, X, Y and Z.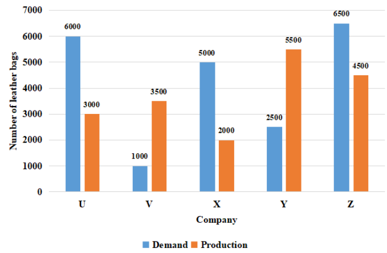
If the production of leather bags by company V is equal to 'm' times of the production of leather bags by company X, then the value of 'm' is: