Section : Quantitative Aptitude
Study the line graph and answer the question that follows.
The line graph represents the number of vehicles (in thousands) manufactured by two automobile companies A and B over the years from 2010 to 2015. The X-axis represents the years and the Y-axis represents number ofvehicles in thousands.
(The data shown here is only for mathematical exercise. They do not represent the actual figures of the country.)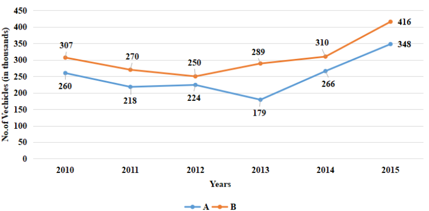
If there was an increase of 24% in the average number of vehicles (in thousands) manufactured by Company B during 2011 to 2014 with respect to number of vehicles manufactured by Company A in 2009. then how many vehicles (in thousands) did Company A manufacture in 2009?
Study the line graph and answer the question that follows.
The line graph represents the number of vehicles (in thousands) manufactured by two automobile companies A and B over the years from 2010 to 2015. The X-axis represents the years and the Y-axis represents number ofvehicles in thousands.
(The data shown here is only for mathematical exercise. They do not represent the actual figures of the country.)
What is the difference between the average number of vehicles (in thousands) of the companies A and B for the years 2010, 2012, 2014 and 2015?
If (7x + 3)3 + (x - 2)3 + 27(2x - 5)3 = 9(7x + 3) (x - 2) (2x - 5), then the value of 5x + 3 is:
What is the value of \(\dfrac{\tan^{2}60^{\circ}-2\sin^{2}45^{\circ}}{\cos24^{\circ}\cos37^{\circ}\csc53^{\circ}\cos60^{\circ}\csc66^{\circ}+\sin^{2}60^{\circ}}\)
Two successive discounts of 40% and 20%, respectively, on the marked price of an article are equal to a single discount of ₹988. The marked price (in ₹) of the article is:
By selling an article for ₹8,670, a man loses 15%. At what price (in ₹) should he sell it in order to make a profit of 15%?