Section : Quantitative Aptitude
The area of a triangular field whose sides are 96 m, 110 m, and 146 m is equal to the area of a rectangular park whose sides are in the ratio 3 : 2. What is the perimeter(in m) of the rectangular park?
The histogram shows the marks scored by 40 students in a test with maximum 30 marks.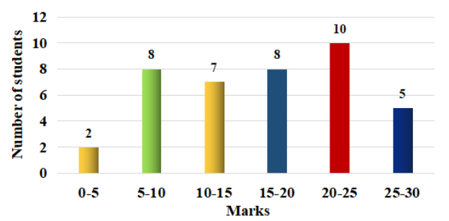
What is the ratio of the number of students who scored marks in the class intervals 10 - 15 and 15 - 20 taken together to that of the students in the class intervals 5 - 10 and 25 - 30 taken together?
If 3 (sec2 θ + tan2 θ) = 5, 0° < θ < 90°, then the value of cosec θ is:
\(\frac{1}{\sqrt{3}}\)
\(\frac{2\sqrt{3}}{3}\)
2
\(\frac{1}{2}\)
If (cos2 θ - 1) (2 sec2 θ) + sec2 θ + 2 tan2 θ = 2, 0° < θ < 90°, then the value of \(\frac{(\sec\theta + \sin\theta)}{(\csc\theta - \cos\theta)}\)
will be:
The value of \(\left(5\frac{5}{6} \div 3\frac{1}{2} \text{ of } \frac{10}{21}\right)
\div
\left(\frac{3}{4} \div 1\frac{1}{2} \text{ of } \frac{4}{5} - \frac{4}{5} \times \frac{1}{2}\right)
\text{ of } \frac{35}{18}\)
If \(x + \frac{1}{x} = 7\), then \(x^{3} + \frac{1}{x^{3}}\) is equal to:
Study the given table and answer the question that follows. In the table, the annual consumption (in hundred tonnes) of coffee in five states (A, B, C, D and E) across six years (2014 to 2019) is given.
By what percentage is the total consumption of coffee in state D from 2014 to 2016 less than the total consumption of coffee in the states A, B, C and E in 2015(correct to one decimal place)?
| State → Year ↓ |
A | B | C | D | E |
| 2014 | 112 | 130 | 136 | 105 | 117 |
| 2015 | 122 | 138 | 150 | 140 | 120 |
| 2016 | 124 | 134 | 142 | 144 | 132 |
| 2017 | 132 | 154 | 198 | 149 | 133 |
| 2018 | 135 | 148 | 187 | 151 | 145 |
| 2019 | 153 | 136 | 198 | 150 | 187 |
Study the given graph and answer the question that follows.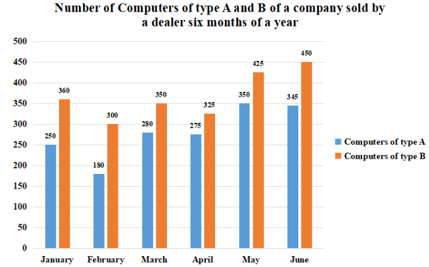
The ratio of the total number of computers of type A sold in February, April and June to the total number of computers of type B sold in April and May is: