The below bar graph shows the number of bikes (in hundreds) sold by Hero and Bajaj over the first six months of 2022.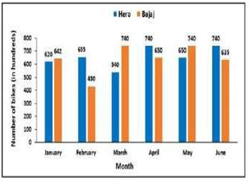
In July, the sales for the number of bikes for Hero company decreased with respect to the previous month by the same percentage as the sales of Hero company decreases in the month of March with respect to February, then find the approximate number of bikes sold by Hero in the month of July.
The bar graph given below shows the temperature recorded every day in a certain week.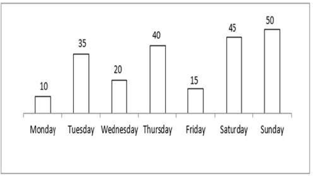
What is the sum of the temperatures recorded on all the days?
If \(\frac{3}{2}\times\frac{7}{3}-\frac{7}{6}+\frac{1}{4}=\frac{1}{x}\), What is the value of x ?
\(\frac{7}{12}\)
\(\frac{4}{13}\)
\(\frac{13}{4}\)
\(\frac{6}{7}\)