The bar graph gien below shows production of truck by two companies L and M in 5 years.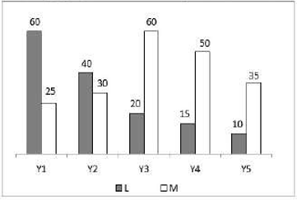
Which of the following statement is NOT correct?
I. The production of truck by company L in year Y1 is 24 percent of the production of company M in year Y1.
II. The ratio of production of truck by company L in year Y4 to the production of truck by company M in year Y4 are 10:3.
III. The average production of truck by company L in year Y2 and Y3 are 30.
The circumference of the two circles is 264m and 308m respectively. What is the difference between the area of the larger circle and the smaller circle ?
What is the value of \(\frac{3}{5}\left(\sec^2 20^\circ - \cot^2 70^\circ\right)\)?
\(\frac{4}{3}\)
\(\frac{5}{3}\)
\(\frac{2}{5}\)
\(\frac{3}{5}\)
The table given below shows the population of two states A and B in 5 years.
| Years | States | |
| A | B | |
| P | 250 | 550 |
| Q | 450 | 350 |
| R | 300 | 200 |
| S | 150 | 100 |
| T | 50 | 250 |
What is the ratio of total population of B in year R,S and T to the total population of A in year P, Q and R ?
Find the area of the circle whose circumference is 22cm.
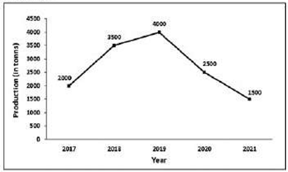
In the following graph the production of rice in 5 consecutive years are plotted. In which year the production of rice is maximum?