A company produced a new energy drink of three different flavours - P, Q and R - for athletes. The production of the three flavours over a period of six years from 2001 to 2006 has been expressed in the bar graph shown below.Study the graph and answer the question that follows.
For which of the following years is the percentage increase/ decrease in production from the previous year the highest for flavour R?
A company produced a new energy drink of three different flavours - P, Q and R - for athletes. The production of the three flavours over a period of six years from 2001 to 2006 has been expressed in the bar graph shown below.Study the graph and answer the question that follows.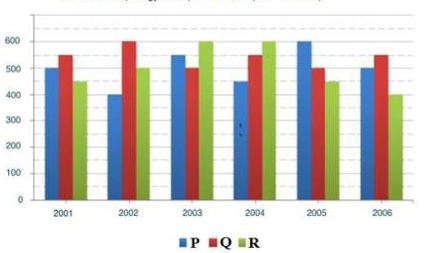
What is the percentage (correct to one decimal place) of the total production of flavour P in 2003 and 2004 with respect to the total production of flavour R in 2001 and 2002?