Study the given pie chart and answer the question that follows:
The pie chart shows the break-up of the total number of employees of a company in 2019, in five departments A, B, C, D, and E.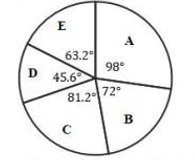
Total number of employees = 4500.
The average number of employees of the company in departments D and E is what percentage of the number of employees in department A (correct to one decimal place)?
The average of 12 numbers is 25.5. The average of the first six numbers is 22.4 and that of the last three numbers is 28.2. The 7th number is 5 less than the 8th number but 10 less than the 9th number. What is the average of the 8th and 9th numbers?
A sum of ₹3,364 is divided in two parts such that the amounts received on them after 3 years and 5 years, respectively, is the same when the rate of interest is 5% p.a., compounded yearly. The difference between the two parts is:
A sum of ₹7,560 is divided between A, B, C and D such that the ratio of the shares of A and B is 4 : 5, that of B and C is 3 : 4 and that of C and D is 5 : 7. What the difference (in ₹) between the shares of B and D?
Kapil rows \(2\frac{1}{2}\)km against the current in 15 minutes and the same distance along the current in 8 minutes. What is the speed (in km/h) of the current?
A sum was invested at simple interest at x% p.a. for 2 years. Had it been invested at (x + 4)%, for the same time, it would have fetched ₹1,800 more. What is the simple interest on the same sum for \(5\frac{2}{3}\) years at 8% p.a.?
Surekha spends 24% of her monthly income on groceries. 16% of it on rent and 55% of the remaining on children's education and others. If she saves ₹5,940 in a month, then how much (in ₹) does she spend on rent?