A rectangular water reservoir contains 126 kilolitres of water. The depth of the reservoir is 3.5 m and its length measures 8 m. What is the width of the reservoir?
The given chart represents the percentage distribution of the population of six villages A, B, C, D, E and F in 2016.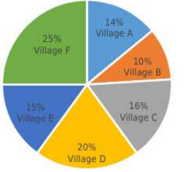
| Village | Percentage of population below the poverty line |
| A | 30% |
| B | 45% |
| C | 55% |
| D | 60% |
| E | 58% |
| F | 40% |
If the population below the poverty line in village A is 42000, then the population above the poverty line in village A is:
Instead of dividing ₹3,910 among P, Q and R in the ratio 4:6:5, by mistake it was divided in the ratio 4 : 5 : 8. By how much did R gain in this transaction?