Quantitative Aptitude
The pie chart given below represents the expenditure of a country on various sports during 2015. Study the pie chart and answer the question that follows.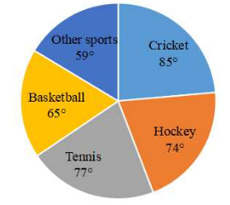
What percentage of the total expenditure is spent on cricket and tennis taken together, during 2015?
The pie chart given below represents the expenditure of a country on various sports during 2015. Study the pie chart and answer the question that follows.
Note: the pie chart is not drawn to scale. The data does not represent the actual numbers. It has been created only for mathematical exercise.
In 2015, there was an increase of 50% and 25%, of expenditure on Cricket and Other Sports, respectively, compared to the previous year. What was the ratio of the expenditure on Cricket to that on Other Sports in 2014?
The profit earned by a company is to be divided among three friends who invested their money in the company, in the proportion of 6: 9: 11. If the share of the person who invested the most is ₹2,310, then what is the sum of the money (in ₹) received by the other two friends?