The difference between the length and the breadth of a rectangle is 16 cm. If its perimeter is 188 cm, then what is its area?
Krish can do a piece of work in 4 days, while Rishi can do the same work in 6 days. Both of them work together and get a total of ₹1,600. What is the share of Rishi?
If 60% of G = \(\frac{4}{5}\) of H, then G is approximately what percentage of H?
The following bar graph shows the number of books sold from four different branches, B1, B2, B3 and B4, of a publishing house, in three consecutive years.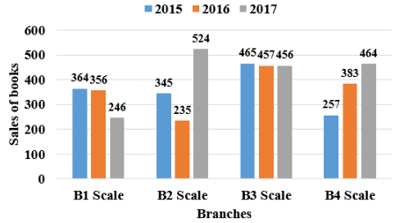
Calculate the total number of books sold from branch B3 during these three years.
A survey was conducted among 3000 people to find the chain of cafes that was most popular. The following pie chart shows the distribution of the percentage of people according to the choice of their favourite cafe.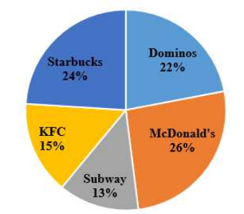
Find the ratio of the number of the people who selected the most popular among the given cafe chains as their favourite to the number of the people who selected the least popular among the given cafe chains as their favourite
The following table shows the total number of votes polled and the percentage of invalid votes in a polling center in a village during the last four Assembly elections.
| Year | Total votes polled | Percentage of Invalid votes |
| 2005 | 6500 | 5% |
| 2010 | 8000 | 7% |
| 2015 | 9400 | 15% |
| 2020 | 10400 | 12% |
What is the sum of the number of valid votes polled in 2010 and 2015 at this center?