if \(P = 2^3 \times 5^8\) \(Q = 3^5 \times 7^3\) What is the least common multiple of P and Q,
\(2^3 \times 3^5 \times 5^8 \times 7^3\)
\(3^5 \times 5^8 \times 7^3\)
\(3^5 \times 5^8\)
\(5^8 \times 7^3\)
Study the given pie-chart and answer the question that follows.
The following pie chart shows the sectors representing the shares of the number of matches played by a team in each of eight consecutive years in terms of the central angles (in degrees) with respect to the total number of matches played by the team in all the eight years taken together.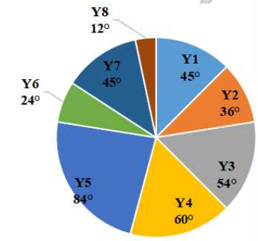
The total number of matches played by the team in the years Y2 and Y5 taken together is approximately what percentage of the total number of matches played by the team in all the eight years taken together?
The population of a village decreases every year at the rate of 3%. If the present population is 28227, what was the population of the village two years ago?
The monihly income of a person is ₹25,000. He spends 80% of his income and saves the rest. His nominal income and his nominal spending both increase by 10%. What will be his new savings?
Study the following table carefully and answer the question.
The following table shows the percentage of population infected and the ratio of males and females infected by COVID-19 in six different cities.
| City | population % infected by COVID-19 | males: females infected |
| Durjanpur | 40 | 3:2 |
| Sitapur | 20 | 2:1 |
| Durgapur | 60 | 5:7 |
| Shyampur | 60 | 7:3 |
| Haripur | 55 | 6:5 |
| Devpur | 25 | 4:1 |
If in Haripur, males infected by COVID-19 was 8436 and in Sitapur, females infected by COVID-19 is 30% less than the females infected by COVID-19 in Haripur, then find out the total number of people infected by COVID-19 in Sitapur.
An article costs ₹750. It is marked up to give 30% profit. What is the selling price if a customer gets a discount of 15% on it?