Quantitative Aptitude
A borrows an amount ₹3,600 from B at a rate of 20% simple interest for 2 years and lends 75% of this amount to C at 20% compound interest for 2 years. A uses the remaining amount for his personal purpose. Find the total loss incurred by A.
What is the value of y in the following equation?
\((1 \div 23)\,\text{of}\,[2\{3 + 4(35 \div 7)\}] = y\)
The slant height and the radius of a right circular cone are 11 cm and 6 cm, respectively. What is the curved surface area of the cone?
The following pie chart shows hypothetical populations of different states (K, R, T, M, P, U, B) in the year 2011.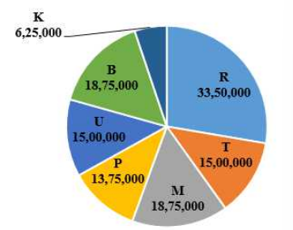
What is the difference between the total population of R and T and the total population of U and B as per data given in the pie chart above?
The following bar graph shows the total number of newspaper readers (in thousands) in a city during 6 consecutive months in a particular year and the respective percentages of the above-mentioned readers who read Hindi newspapers. The rest of the readers read English newspapers.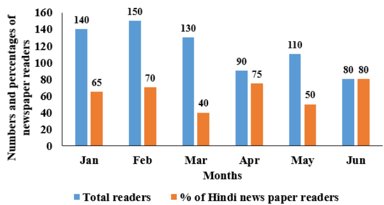
Note: Total readers = Hindi newspaper readers + English newspaper readers
What is the difference between the number of Hindi newspaper readers during January, February and April taken together and that of English newspaper readers during March, May and June taken together?
The cost of building a fence around a circular field is ₹7,425 at the rate of ₹13.50 per foot. What is the area of the circular field? \(\text{(Use }\pi = \tfrac{22}{7}\text{)}\)
If P1,P2 and P3 are three distinct prime numbers, then what is the least common multiple of P1, P2 and P3 ?