The following pie chart gives the central angles of the sectors representing the number of cameras sold from a shop from July to November in a certain year.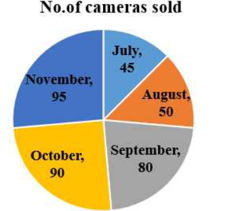
What percentage are the sales in July of the total sales from July to November?
What is the value of \( \frac{7}{8} + \frac{8}{11} \text{ of } \left[ \frac{33}{16} - \frac{5}{12} + \left( \frac{6}{11} - \frac{5}{12} + \frac{7}{22} \right) \right] \)
\( \frac{6871}{3605} \)
\( \frac{6805}{2987} \)
\( \frac{6907}{3971} \)
\( \frac{6961}{2904} \)
The following bar chart shows the number of accounts (in '00) opened in a month by 5 banks.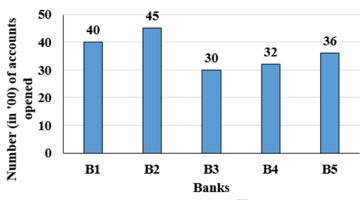
The average money in each account of B1, B3 and B5 is ₹500. The average money in each account of B2 and B4 is ₹1,000. How much money is there in all the accounts that have been opened during the given month, in all the 5 banks, taken together?