The following table shows the total sale of cars of four companies from 2015 to 2018.
| Year / Car | Tata | Hyundai | Mahindra | Toyota |
| 2015 | 465 | 472 | 486 | 482 |
| 2016 | 375 | 427 | 379 | 419 |
| 2017 | 246 | 357 | 236 | 523 |
| 2018 | 456 | 357 | 484 | 475 |
In which year was the total number of cars sold by these four companies taken together the maximum?
The following graph shows the number of cars of different colours in a society.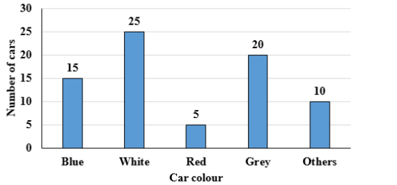
What is the approximate percentage of white colour cars out of all cars in the society?