Quantitative Aptitude
A shopkeeper sells an item at a loss of 8%. However, if he increases the selling price by ₹36, he could gain 12%. Find the cost price of the article (in ₹).
The given bar graph given below provides information about the quantity of salt produced by a company in 8 consecutive years. Study the information provided in the bar graph and answer the question that follows.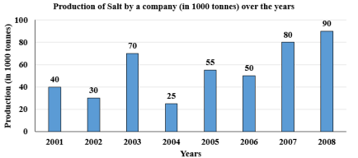
The average production of salt in 2001 and 2003 was exactly equal to the average production of salt in which of the following pairs of years?
The pie chart given below shows the number of laptops sold of each of 7 different brands in a year as percentages of the total number of laptops sold of all these 7 brands taken together in that year.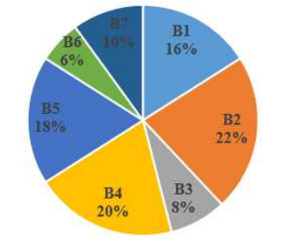
What is the difference between the measures of the central angles made by sector B2 and sector B5?
Find a single discount equivalent to two successive discounts of 12% and 8%.