Quantitative Aptitude
The cost prices of a table and a chair are ₹400 and ₹1,200, respectively. The table and the chair are sold at profits of 50% and 20%, respectively. What is the overall profit percentage gained from the two sales taken together?
The following bar graph shows the sales of two wheelers from three different branches of a company during two consecutive years 2018 and 2019.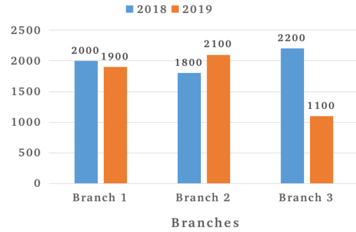
What is the average sale of all the branches in the year 2019?
The difference between the compound interest, when compounded annually, and the simple interest on a certain sum of money for 2 years at 4.2% is ₹8.82. What is the sum?
If a : b = b : c, then what is the value of a6 :b6 ?
\( a^{3} : b^{3} \)
\( b^{3} : ac \)
\( a^{3} : c^{3} \)
\( a^{2} : b^{2} \)
The following table shows the amount (in quintals) of 6 different types of sweets sold by a shop during a given year.
| Sweet | Amount |
| S1 | 32 |
| S2 | 48 |
| S3 | 23 |
| S4 | 37 |
| S5 | 39 |
| S6 | 21 |
The amount of S1 sold in that year was what percentage of the average amount of sweets sold per type during that year?
If ₹39,500 is divided into three parts in the ratio 24 : 15 : 40, then what is the value of the third part, in the given order?
What is the value of
is