The value of \( \frac{1}{27} \) of 3375 + 44% of 2775 is:
The following table shows the number of flowers of different colours in a garden.
| Colour of flower | Number of flowers |
| Pink | 4 |
| Purple | 6 |
| Blue | 7 |
| Red | 3 |
| Yellow | 8 |
What is the total number of flowers in the garden, except the blue-coloured ones?
Study the given pie-chart and answer the question that follows. The pie-chart represents the shares of the number of different flavours of pizzas sold on a random day.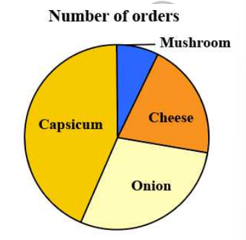
Which flavour of pizza is the most ordered one?
The following pie chart gives the central angles of the various sectors representing the number of employees in different departments in a company.
The number of employees in the marketing department is what percentage of the number of employees in all the departments taken together?
If the adjacent sides of a rectangle, whose perimeter is 66 m, are in the ratio 5 : 6, then what will be the area of the rectangle?
In what time will ₹13,000 lent at 4 per cent per annum on simple interest amount to ₹13,780?
1 year 6 months
2 year 6 months
2 year 3 months
1 year 5 months
The lengths of the diagonals of a rhombus are 16 cm and 30 cm, respectively. What is the perimeter of the rhombus?