Quantitative Aptitude
The total salary of two employees, A and B, in an organisation was ₹40,000. After increasing the salary of A by 9% and of B by 11%, the total salary of A and B becomes ₹44,100. What was the initial salary of A?
The following bar graph shows the number of students in five different sections of Class 10.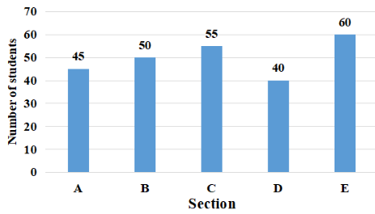
What is the positive difference between the numbers of students in Section C and in Section D?
What should come in place of the question mark(?) in the following question?
\(2 \times 324 \times ? = 9^2 \times 22^2 \times 6\)
Find the volume of a sphere having a diameter of 6 mm, in terms of π
The ratio of the length to the width of a rectangle is 3 : 2. If the length of this rectangle is increased by 25% and its width is kept constant, then the area of the rectangle increases by 24 m2. What is the width of this rectangle?
Simplify the following expression.
12 + 11 - 13 +(4 +3)
If △ABC is similar △DEF such that BC= 3 cm, EF = 4 cm and the area of △ABC = 54 cm2, then the area of DEF is:
The table below shows the number of toys of 6 different colours sold from a shop during a given period. The table also shows the percentage of toys of each colour which are cars.
| Colour | Total toys | Percentage of cars |
| C1 | 500 | 12 |
| C2 | 600 | 15 |
| C3 | 400 | 12.5 |
| C4 | 550 | 10 |
| C5 | 650 | 20 |
| C6 | 450 | 10 |
What is the total number of car toys of C2 and C3 taken together?