A table showing the percentages of the total population of a town by age groups for the year 2016 is given below.
| Age Group (in years) | Per cent |
| up to 15 | 35 |
| 16–30 | 18.5 |
| 30–40 | 12.5 |
| 40–50 | 25.77 |
| 51 and above | 8.23 |
There are 2200 billion people below 40 years. How many billion people are in the age group 40-50?
A is 25% more than B, and B is 40% less than C. If C is 20% more than D, then by what percentage is A less than D?
The following pie chart gives the monthly budget of a family on the heads – Food, Rent, Education, Charity and Savings. The total income of the family is ₹9,000. Study the pie chart carefully and answer the question.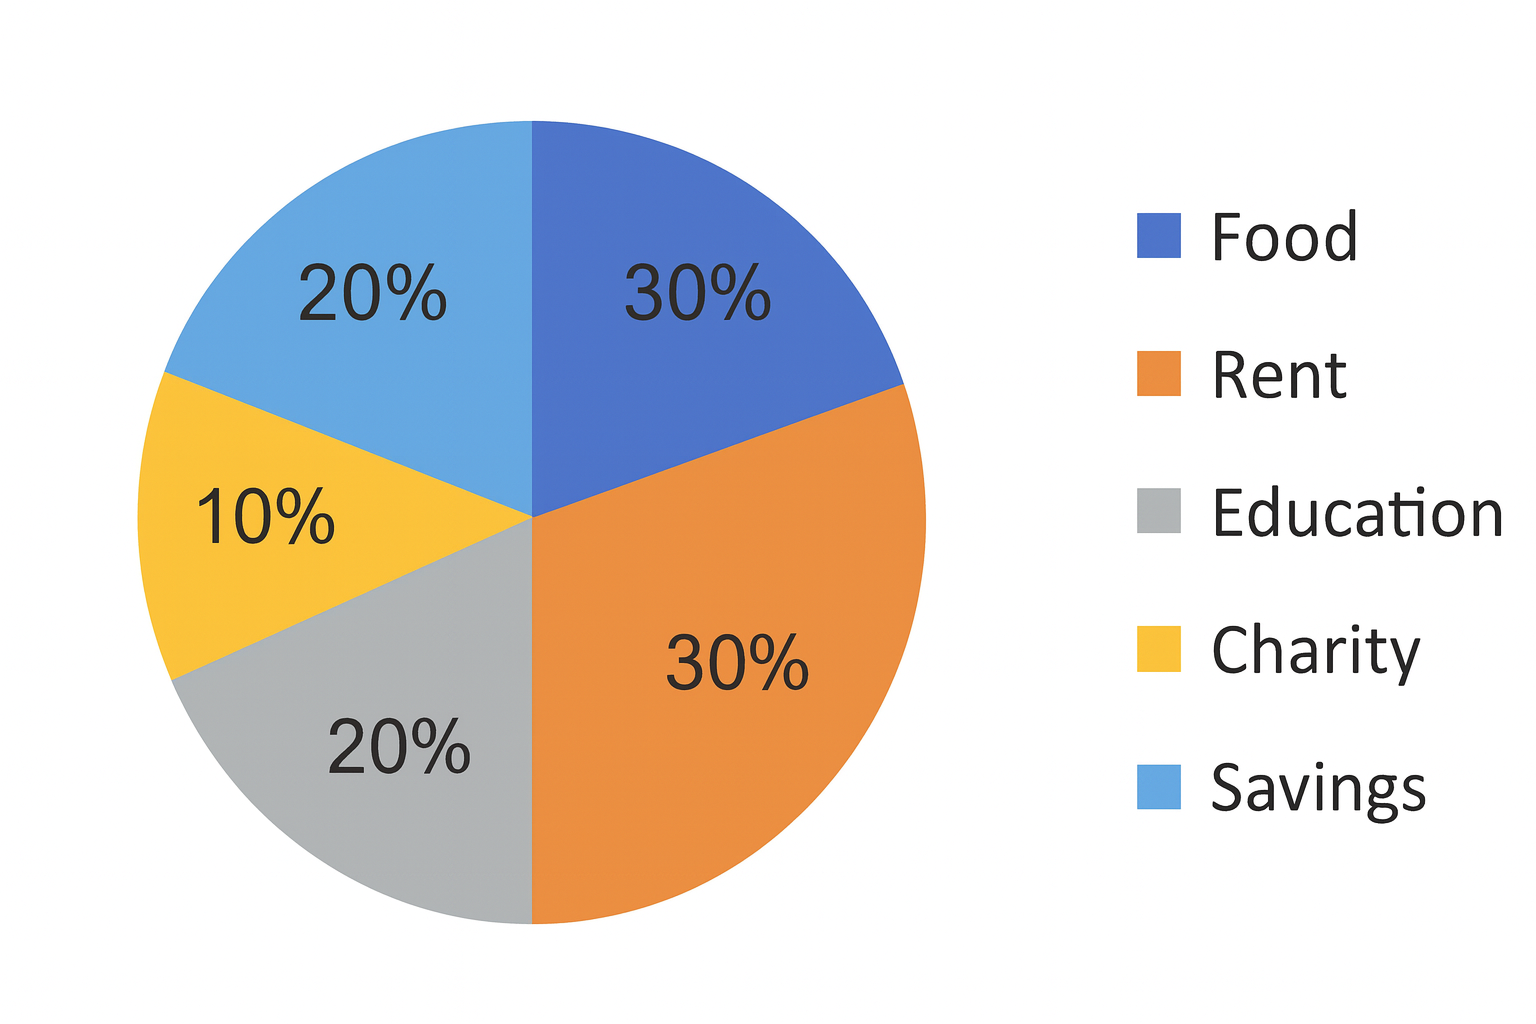
What is the total expenditure on the heads - rent, savings, food and education?
Two tankers contain 850 litres and 680 litres of oil. Find the maximum capacity of a container which can measure the oil of both tankers when used, an exact number of times.
A and B can finish a work in \(5\tfrac{1}{3}\ \text{days}\). A alone can finish the work in 8 days. A and B worked on alternate days (starting with B) to finish the work.In how many days will the work be finished.?
6 days
\(11\tfrac{1}{3}\ \text{days}\)
11 days
\(6\tfrac{1}{3}\ \text{days}\)