Data Interpretation SSC CGL Questions

Data Interpretation MCQ Questions

7.
Study the given pie chart and answer the question that follows:
The chart represents the percentage-wise distribution of total number of vanilla cakes and chocolate cakes sold every day in a week.
Total number of cakes sold in a week = 10500.
 
The ratio of vanilla cakes sold to chocolate cakes sold on Friday is 4:3. If the selling price of one vanilla cake is ₹9 and that of one chocolate cake is ₹10, then the total amount earned (in ₹) by selling all the vanilla cakes and chocolate cakes on Friday is:
SSC CGL 2021-13.04.2022-3
A.
11,000
B.
8,900
C.
10,000
D.
9,900
ANSWER :
D. 9,900
8.
Monthly expenditure of a family on different heads is shown in the following pie chart. The family earns ₹1,08,000 every month.
How much (in Rs.) does the family spend on food and transport?

SSC CGL 2021-18.04.2022-3
A.
34,000
B.
35,250
C.
34,800
D.
34,500
ANSWER :
D. 34,500
9.
The given pie charts show the number of start-ups in various industries since 2010 and the number of successful start-ups in those industries.
Study the charts and answer the question that follows.
Start-upsc in various industries started in 2010
Number of Startups

Successful start-ups in various industries.

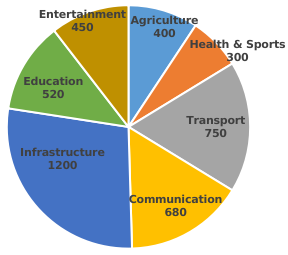
What should be the increase in the number (to the nearest integer) of successful start-ups in the industry of Health and Sports, so that its success % is the same as that of education?
SSC CGL 2021-19.04.2022-2
A.
220
B.
155
C.
187
D.
127
ANSWER :
D. 127
10.
Performance of 1800 students in grades has been shown in the following pie chart.
How many students have got either grade D or grade E?

SSC CGL 2021-19.04.2022-3
A.
345
B.
352
C.
342
D.
359
ANSWER :
C. 342
11.
Performance of 1800 students in grades has been shown in the following pie chart.
How many more students have obtained grade B than those who have obtained grade C?

SSC CGL 2021-20.04.2022-3
A.
50
B.
60
C.
54
D.
3
ANSWER :
C. 54
12.
The breakup of the total number of employees of a company working in different offices (A to E) in degrees, is given in the pie chart.
Total number of emplyees = 2400.

If 40% of the number of employees in office A are shifted equally to office B and E, then what will be the sum of the number of employees in B and C?
SSC CGL 2021-21.04.2022-1
A.
648
B.
735
C.
545
D.
72
ANSWER :
A. 648