Data Interpretation SSC CGL Questions

Data Interpretation MCQ Questions

13.
The breakup of the total number of employees of a company working in different offices (A to E), in degrees, is given in the pie chart.
Total number of employees = 2400.

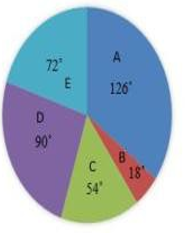
If the percentage of male employees in Office C is 20% and that of female employees in E is 40%, then what is the ratio of the number of female employees in E to that of female employees in C?
SSC CGL 2021-21.04.2022-2
A.
3:08
B.
5:04
C.
2:03
D.
3:02
ANSWER :
C. 2:03
14.
Monthly expenditure of a family on different heads is shown in the following pie chart. The family earns Rs.1,08,000 every month.
What is the amount spent on Rent every month (in ₹)?

SSC CGL 2021-21.04.2022-3
A.
17,500
B.
21,000
C.
15,000
D.
18,000
ANSWER :
D. 18,000
15.
The pie chart given below shows the number of truck sold by 8 different companies. The total number of truck sold by all these 8 companies are 4000. Number of truck sold by a particular company is shown as a percent of total number of truck sold by all these 8 companies

The number of trucks sold by B, C, F and H is how much percent less than the number of trucks sold by all these 8 companies?
SSC CGL 2022-01.12.2022-1
A.
46 percent
B.
22 percent
C.
34 percent
D.
14 percent
ANSWER :
C. 34 percent
16.
The pie chart given below shows the number of bike sold by 8 different companies. The total number of bike sold by all these 8 companies are 2000. Number of bikes sold by a particular company is shown as a percent of total number of bike sold by all these 8 companies.

What is the difference between the average number of bikes sold by P, Q, R and S and the average number of bikes sold by T, U, V and W?
SSC CGL 2022-01.12.2022-3
A.
150
B.
200
C.
175
D.
125
ANSWER :
A. 150
17.
The pie chart given below shows the production of 6 different factories. The total production of all these 6 factories are 22000. The production of a particular factory is shown as a percent of total production of all these 6 factories.

P1 = The value of average production of A, C, D and F.
P2 = The difference between the production of B and E. What is the value of (P1 + P2)?
SSC CGL 2022-01.12.2022-4
A.
2525
B.
6545
C.
3525
D.
4565
ANSWER :
D. 4565
18.
The pie chart given below shows the sales of 7 different companies. The total sales of all these 7 companies are 2880. The sale of a particular company is shown in terms of degree with respect to the total sales of all these 7 companies.

The average sales of G and H is how much percent more than the average sales of D and I?
SSC CGL 2022-01.12.2022-4
A.
18.86%
B.
25.25%
C.
56.21%
D.
22.86%
ANSWER :
D. 22.86%