
The given histogram represents the marks of students in Maths test of a certain class.
The total number of students is 350.
Study the graph and answer the questions that follow.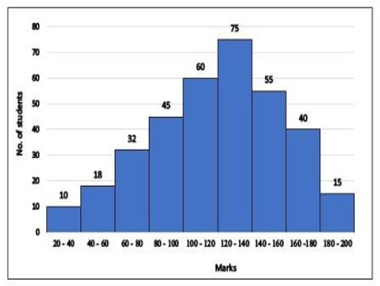
What is the ratio of the total number of students who scored 140 marks and above to the total number of students who scored marks between 60 and 120?
SSC CGL 2021-11.04.2022-1
The given bar graph shows the exports of cars of type A and B (in millions) from 2014 to 2018. Study the graph and answer the question that follows.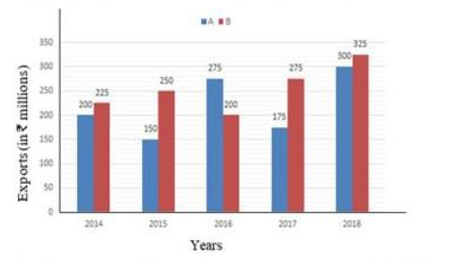
What is the ratio of the total exports of cars of type A in 2014 and 2018 to the total exports of cars of type B in 2015 and 2017?
SSC CGL 2021-12.04.2022-1
The given pie chart shows the percentage of students in five schools and the table shows the ratio of boys and girls in each school.
Study the pie chart and answer the question.
The below table shows the ratio of girls and boys in the given 5 schools.
| School | Girls:Boys |
| A | 3:4 |
| B | 2:3 |
| C | 5:3 |
| D | 1:2 |
| E | 4:1 |
If the total number of girls from all five schools is represented as a pie chart, then what will be the measure of the sector angle (to the nearest integer) corresponding to school B?
SSC CGL 2021-12.04.2022-3