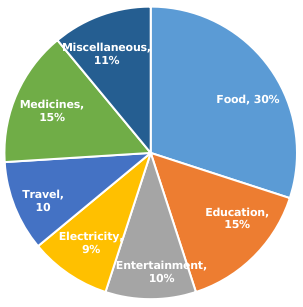
The given pie charts show the monthly household expenditure of Family A and Family B under various heads. The monthly expenditures incurred for Family A and Family B are ₹50,000 and ₹75,000, respectively.
Study the charts carefully and answer the question that follows.
Monthly Household Expenditure of ₹50,000 under various heads of Family A
Monthly Household Expenditure of ₹75,000 under various heads for Family B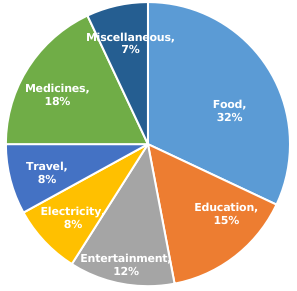
If the monthly expenditures of both families are combined together then the expenditures on Entertainment of both families together will be what percentage of the total monthly expenditures of both families? Express your answer to the nearest integer.
If x + y + z = 18, xyz = 81 and xy + yz + zx = 90, then the value of x3 + y3 + z3 + xyz is:
A tea seller used to make 50% of profit by selling tea at ₹9 per cup. When the cost of ingredients increased by 25%, he started selling tea at ₹10 per cup. What is his profit percentage now?
If 4 men and 6 boys can do a work in 8 days and 6 men and 4 boys can do the same work in 7 days, then how many days will 5 men and 4 boys take to do the same work?
A shopkeeper allows 28% discount on the marked price of an article and still makes a profit of 20%. If he gains ₹3,084 on the sale of one article, then what is the selling price of the article?
What is the value of x, if
In a triangle ABC, D and E are points on BC such that AD = AE and ∠BAD = ∠CAE. If AB = (2p + 3), BD = 2p, AC = (3q - 1) and CE = q, then find the value of (p + q)
A kite flying at a height of 120 m is attached to a string which makes an angle of 60° with the horizontal. What is the length (in m) of the string?
The given pie chart represents the percentage wise distribution of the total number of vanilla cakes and chocolate cakes sold every day.
The total number of cakes sold in a week = 10500.
Study the pie chart and answer the question that follows.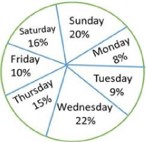
The ratio of vanilla cakes sold to chocolate cakes sold on Friday is 4:3. If the price of one vanilla cake is ₹9 and that of one chocolate cake is ₹10, then the total amount earned (in ₹) by selling all vanilla cakes and chocolate cakes on Friday is: