Simple interest on a certain sum is one-fourth of the sum and the interest rate percentage per annum is 4 times the number of years. If the rate of interest increases by 2%, then what will be the simple interest (in ₹) on ₹5,000 for 3 years?
The given bar graph shows the income and expenditure (in crores ₹) of a company over 5 years, from 2014 to 2018.
Study the bar graph and answer the question that follows.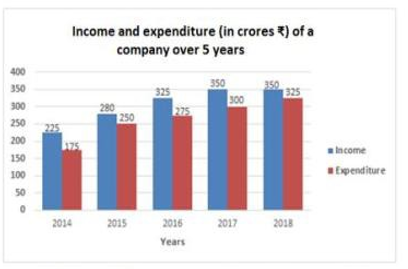
In which of the following years is the ratio of expenditure to income the minimum?
The following histogram shows the marks scored by 40 students in a test of 30 marks. A student has to score a minimum of 10 marks to pass the test.
How many students have passed the test and obtained less than 50% of marks?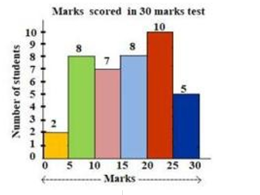
General English
Select the option that expresses the given sentence in direct speech.
Manan said that he had no work to do that day.
Manan said, “I have no work to do today.”
Manan said, “I have no work to do that day.”
Manan said, “Have I no work to do today?”
Manan says, “I had no work to do that day.”