Study the bar graph and answer the question that follows.
The bar graph shows the exports of cars of type A and B (in ₹ millions) from 2014 to 2018.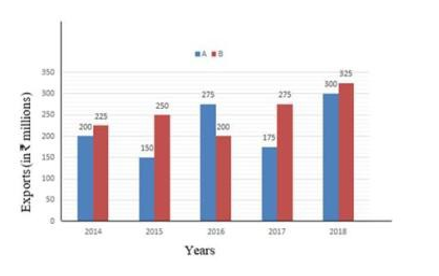
The total exports of cars of type A from 2014 to 2016 is approximately what percentage less than the total exports of cars of type B from 2015 to 2017 (correct to one decimal place)?
Simplify the following expression:
\(
\mathrm{cosec}^{4}A \,(1 - \cos^{4}A) - 2\cot^{2}A - 1
\)
The following pie chart shows the % distribution of a certain corporate office employees in various age-groups.
Total number of employees of the corporate office = 2500
Study the chart and answer the questions that follows.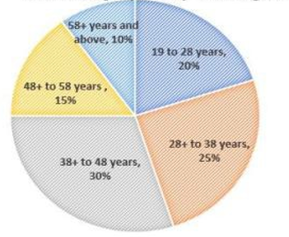
The number of the corporate office employees of age group of 38+ years and above is how much percentage more than that of 28+ to 38 years?
If 6 tanA (tanA + 1) = 5 - tanA, Given that 0 < A < \( \frac{π}{2} \), what is the value of (sinA + cosA)?
3\(\sqrt{5}\)
\(\dfrac{5}{\sqrt{3}}\)
5\(\sqrt{3}\)
\(\dfrac{3}{\sqrt{5}}\)
The number of cars passing the road near a colony from 6am to 12noon has been shown in the following histogram. What is the minimum percentage change in the number of cars in comparison to the previous hour? (correct to 2 decimal places)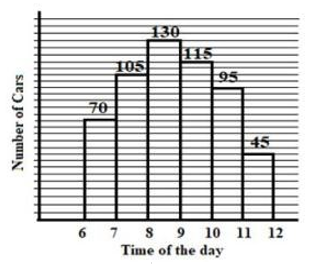
Points A and B are on a circle with centre O. PA and PB are tangents to the circle from an external point P. If PA and PB are inclined to each other at 42° , then find the measure of ∠OAB.
\(\text{If } \left(0.4x + \frac{1}{x}\right) = 5,\) what is the value of \(\left(0.064x^{3} + \tfrac{1}{x^{3}}\right)\)