The difference between compound interest compounded annually and simple interest on a certain sum at a rate of 15% per annum for 2 years is ₹1,944. Find the compound interest compounded annually (in ₹) on the same sum for the same period at a rate of 10% per annum.
A shopkeeper allows a 28% discount on the marked price of an article and still makes a profit of 20%. If he gains ₹30.80 on the sale of one article, then what is the selling price (in ₹) of the article?
The inner circumference of a circular path enclosed between two concentric circles is 264 m. The uniform width of the circular path is 3 m. What is the area (in m², to the nearest whole number) of the path? \(\text{(Take } \pi = \frac{22}{7}\text{)}\)
The given bar chart represents the number of TV sets manufactured (in thousands) and the respective % of those TV sets sold by five different companies A,B,C,D,E in 2015.
Study the chart carefully and answer the question that follows.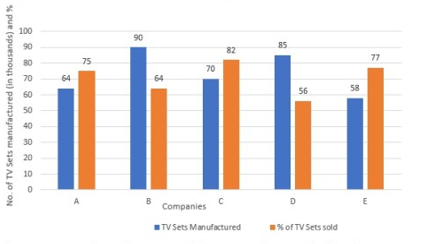
The average number of TV sets sold by companies C and D is what percentage of the number of TV sets manufactured by company E? Express your answer correct to one place of decimal.