The following pie chart shows the spending of a country on tourism in various states during the year 2012.
Total spending of the country = ₹. 49,62,000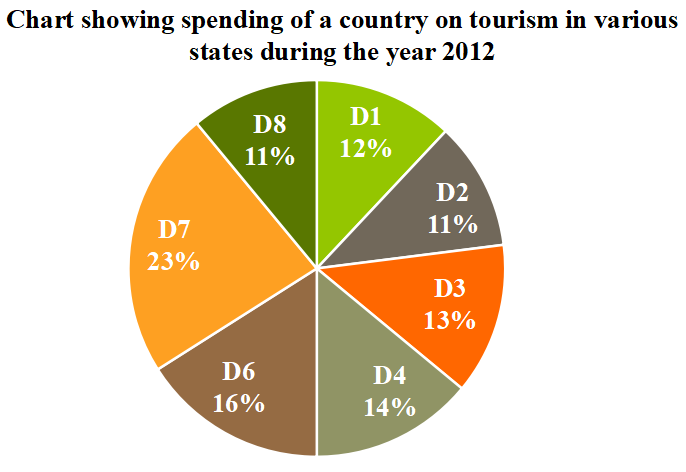
The amount spent on state together D1 and D4 exceeds that spent on together D2 and D8 by:
In the given figure, AB = DB sad AC = DC. If ∠ABD = 58° and ∠DBC = (2x - 4)°, ∠ACB = (y + 15)° and ∠DCB = 63° , then the value of 2x + 5y is:
Study the given table and answer the question that follows.
The table shows the number of customers for different services in different cities.
| City → Services ↓ |
X | Y | Z |
| A | 250 | 175 | 350 |
| B | 220 | 190 | 240 |
| C | 260 | 200 | 270 |
| D | 245 | 185 | 330 |
In which service is the average number of customers per city the highest?
On simple interest a sum of ₹640 becomes ₹832 in 2 years. What will ₹860 become in 4 years at the same rate of simple interest?
If x+\( \frac{1}{x} \) =8, then find the value of \(\;\frac{5}{x^{2} - 8x + 2}\)
Study the table given below and answer the questions that follow.
| Countries | Number of Tests | Positive cases | Number of patients for Ventilators |
| The US | 14000 | 12% | 20% |
| Spain | 12000 | 8% | 12.5% |
| Italy | 10000 | 12% | 16% |
| China | 10000 | 11% | 15% |
According to the table given above, which country has the maximum number of positive cases?