Study the given graph and table, and answer the question.
Data of different states regarding population of states in the year 1998.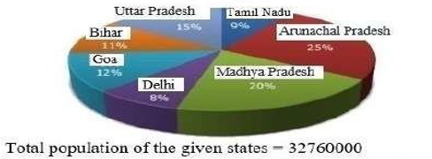
| States |
Sex and Literacy wise population ratio
|
|||
| Sex | Literacy | |||
| M | F | Literate | Illiterate | |
| Arunachal Pradesh | 5 | 3 | 2 | 7 |
| Madhya Pradesh | 3 | 1 | 1 | 4 |
| Delhi | 2 | 3 | 2 | 1 |
| Goa | 3 | 5 | 3 | 2 |
| Bihar | 3 | 4 | 4 | 1 |
| Uttar Pradesh | 3 | 2 | 7 | 2 |
| Tamil Nadu | 3 | 4 | 9 | 4 |
If in the year 1998, there was an increase of 20% in the population of Goa and 10% in the population of Arunachal Pradesh compared to the previous year, then what was the ratio of populations of Goa and Arunachal Pradesh in 1997?
Suman paid ₹9,600 in interest on a loan she obtained 5 years ago with a simple interest rate of 16%. What was the amount of the loan she had taken?
The following pie chart represents the units of electricity sold to various categories in a month by an Electrical supplier.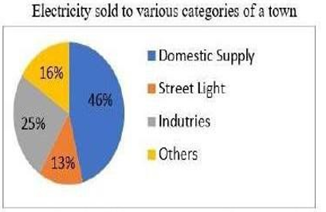
The central angle of the sector corresponding to supply for Industries is:
What is the HCF of 36 and 198?
The cost of a piece of diamond varies with the square of its weight. A diamond of Rs.6,084 value is cut into 3 pieces whose weights are in the ratio 3 : 2 : 1. Find the loss involved in the cutting.
\(
x + \frac{1}{x} = -2,
\) then what is the value of x17 + x-17 + x12 + x-12 ? (x<0)