The import and export of a country (in lakhs rupees) during a certain period of time is given in the following bar graph.
Read the bar graph carefully and answer the following questions.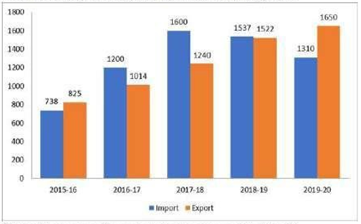
What is the average of exports during the given period of time?
Rs.1,250.2 lakhs
Rs. 1,240.0 lakhs
Rs.1,248.2 lakhs
Rs. 1,115.4 lakhs
A number when divided by 7 leaves remainder of 4. If the square of the same number is divided by 7, then what is the remainder?
The given table shows the number of new employees joined in different categories of employees in an organisation and also the number of employees from these categories who left the organisation every year since the foundation of the organisation in 2015.
Study the table and answer the question that follows.
| Year | Business Analysts | Accountants | Sales Representatives | Peons | ||||
| Joined | Left | Joined | Left | Joined | Left | Joined | Left | |
| 2015 | 80 | 0 | 35 | 0 | 50 | 0 | 73 | 0 |
| 2016 | 63 | 21 | 26 | 16 | 46 | 20 | 34 | 23 |
| 2017 | 78 | 28 | 15 | 5 | 38 | 15 | 48 | 29 |
| 2018 | 42 | 39 | 20 | 38 | 34 | 14 | 14 | 12 |
| 2019 | 67 | 44 | 14 | 24 | 22 | 30 | 21 | 30 |
During the years given, what is the difference between the total number of business analysts who joined the organisationand the total number of sales representatives who joined the organisation?
If cot B = 9, then what will be the value of sec2 B?