Study the table ( income in $) and answer the question that follows
| Source of Income | Adam | Brad | Christy | David |
| Salary | 350 | 200 | 460 | 500 |
| Bonus | 90 | 40 | 115 | 130 |
| Overtime | 160 | 65 | 170 | 185 |
| Arrears | 200 | 125 | 145 | 235 |
| Total | 800 | 430 | 890 | 1050 |
The following pie chart represents the total expenditure of Rs. 12,00,000 on several items in consturction of a house in a village.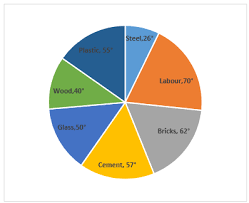
The percentage of the total expenditures spent on Cement, Wood and Plastic (correct to 2 decimal places) is:
Select the correct algebraic expression.
ab - a - b + 1 = (a - 1)(b - 1)
ab + a - b + 1 = (1 - a)(1 - b) (1 - a)(1 + b)
ab - a - b + 1 = (1 - a)(b - 1)
ab - a - b + 1 = (a - 1)(1 - b)
What is the value of
Mr. X has a monthly income of $26,500 and his monthly expenditure is $20,500. The next year, his salary is increased by 12% and expenditure is increased by 6%. His savings increase by how much percent?
The given table shows the number of new employees who joined in different categories of employees in an organisation and also the number of employees from these categories who left the organisation every year since the foundation of the organisation in 2015. Study the table and answer the question that follows:
| Year | Business Analysts | Accountants | Sales Representatives | Peons | ||||
| Joined | Left | Joined | Left | Joined | Left | Joined | Left | |
| 2015 | 80 | 0 | 35 | 0 | 50 | 0 | 73 | 0 |
| 2016 | 63 | 21 | 26 | 16 | 46 | 20 | 34 | 23 |
| 2017 | 78 | 28 | 15 | 5 | 38 | 15 | 48 | 29 |
| 2018 | 42 | 39 | 20 | 38 | 34 | 0 | 14 | 12 |
| 2019 | 67 | 44 | 14 | 24 | 22 | 30 | 21 | 30 |
What was the total number of accountants working in the organisation in the year 2019?