△PQR is an isosceles triangle and PQ = PR = 2a unit, QR = a unit. Draw PX ⊥ QR, and find the length of PX.
\( \sqrt{5a} \)
\( \frac{\sqrt{5a}}{2} \)
\( \frac{\sqrt{10a}}{2} \)
\( \frac{\sqrt{15a}}{2} \)
The following pie chart shows the number of workers of different categories A,B,C,D,E,F,G,H in a factory in 1995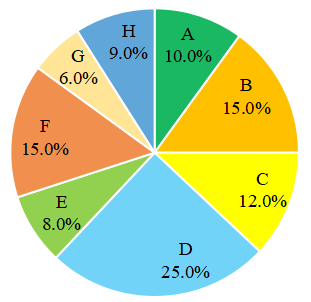
What is the central angle (angular value) for category B of the pie chart?
If, for a non-zero x, 5x² + 7x + 5 = 0, then the value of x³ + \( x^3 + \frac{1}{x^3} \)
is:
\( \frac{496}{125} \)
\( \frac{532}{343} \)
\( \frac{125}{532} \)
\( \frac{182}{125} \)
1 man and 4 women can complete a work in \( \frac{65}{4} \) days while 3 men and 4 women can complete it in \( \frac{13}{2} \) days, In how many days will 13 women complete the same work ?
The table below shows number of calculators sold by 5 shopkeepers.
| Shopkeepers | Calculator |
| S1 | 40 |
| S2 | 60 |
| S3 | 55 |
| S4 | 35 |
| S5 | 80 |
Number of calculator sold by S5 is what percent of the number of calculator sold by S1?
What is the value of cos² 15°?
\( (2 + \sqrt{3}) \)
\( \frac{(2 + \sqrt{3})}{4} \)
\( \frac{(2 + \sqrt{3})}{2} \)
\( \frac{(1 + \sqrt{3})}{2} \)