The table shows the consumption of grains in terms of kilograms of a small village per day over the given set of years. Study the table and answer the questions that follows.
| Year | Rice | Wheat | Maize | Barley |
| 1998-2000 | 181 | 50 | 35 | 26 |
| 2003-2005 | 167 | 44 | 39 | 17 |
| 2008-2010 | 169 | 38 | 49 | 25 |
| 2013-2015 | 150 | 45 | 51 | 21 |
| 2018-2020 | 147 | 54 | 63 | 24 |
For wheat grains, for the given set of years, the highest consumption is approximately how much percent of that of all grains consumption per day in such a set of years?
Steel is used to make a hemispherical bowl that is 0.37 cm thick. The bowl's inner radius is 6 cm. Find the bowl's outside curved surface area (take \( \pi = \frac{22}{7} \)).
If tan²α = 3 + Q2, then sec α + tan3 α cosec α = ?
\( (3 + Q^2)^{\frac{3}{2}} \)
\( (7 + Q^2)^{\frac{3}{2}} \)
\( (5 - Q^2)^{\frac{3}{2}} \)
\( (4 + Q^2)^{\frac{3}{2}} \)
The height of an equilateral triangle is 9\(\sqrt{3}\) cm. What is the area of this equilateral triangle?
92\(\sqrt{3}\) cm²
67\(\sqrt{3}\) cm²
49\(\sqrt{3}\) cm²
81\(\sqrt{3}\) cm²
The given bar graph shows the data of the production of rice (in lakh tons) by 3 different countries P,Q and R over the years mentioned. Study the graph and answer the question.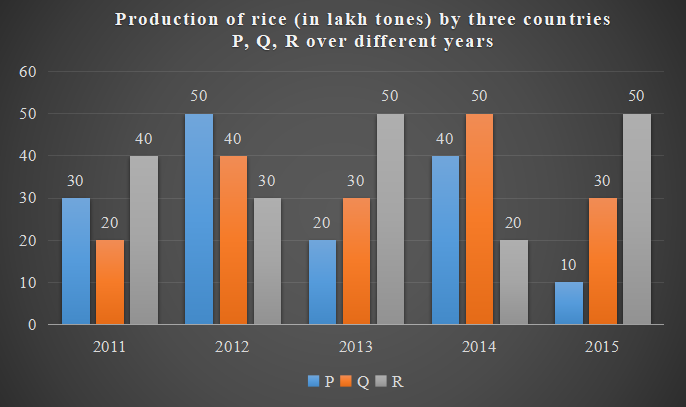
The average production for the five years is maximum for which country?
Simplify the equation. What is the difference between the two values of x?
If a number K = 42 × 25 × 54 × 135 is divisible by 3a, then find the maximum value of a.
If x² + y² + 2y + 4x + 5 = 0, then
\[
\frac{x+y}{x-y} = \_\_\_\_\_\_ .
\]