A shopkeeper sells an article at \( 13 \tfrac{1}{2} \% 6 \) loss. If he sells it for ₹1,274 more, then he gains 11%. What is the cost price of the article?
The table given below shows the expenditure of two companies in different years.
| Years | Companies | |
| L | M | |
| P | 200 | 500 |
| Q | 150 | 350 |
| R | 300 | 250 |
| S | 100 | 150 |
| T | 400 | 100 |
J1 = The toal expenditure of company L in all the 5 years
J2 = The toal expenditure of company M in all the 5 years
What is the value of (J1 : J2)?
The pie chart given below shows the number of cars sold by 8 companies.
The total number of car sold by all these 8 companies are 10,000. Number of cars sold by a particular company is shown as a percent of total number of cars sold by all these 8 companies.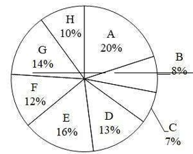
Which of the following statement is correct?
I. The average number of cars sold by company B, F and H are 100.
II. The ratio of number of cars sold by A to the number of cars sold by E are 4:5
If \(
K + \frac{1}{K} + 2 = 0
\) and k<0, then what is the value of \(
K^{10} + \frac{1}{K^{11}}
\)
What is the value of cos45° sin15°?
\( \frac{(\sqrt{3} - 1)}{2} \)
\( \frac{(\sqrt{3} - 1)}{4} \)
\( (\sqrt{3} + 1) \)
\( 2\sqrt{3} - 1 \)
If \(
x + \frac{1}{x} = 2 ,
\) then what is the value of \( x^3 + \frac{1}{x^3} = ? \)
Study the table and select the correct statement
| Height (in cm) | Weight (in kg) |
| 156 | 69 |
| 155 | 68 |
| 145 | 61 |
| 142 | 60 |
| 141 | 58 |
| 139 | 55 |
| 135 | 45 |
Weight increases with the increase in height.
Weight increases with the decrease in height.
Weight decreases with the increase in height.
Height and weight are not related to each other.