The following graph shows sale of books (in 1000s) from 6 branches of a publishing company during two consequetive years 2018 and 2019. 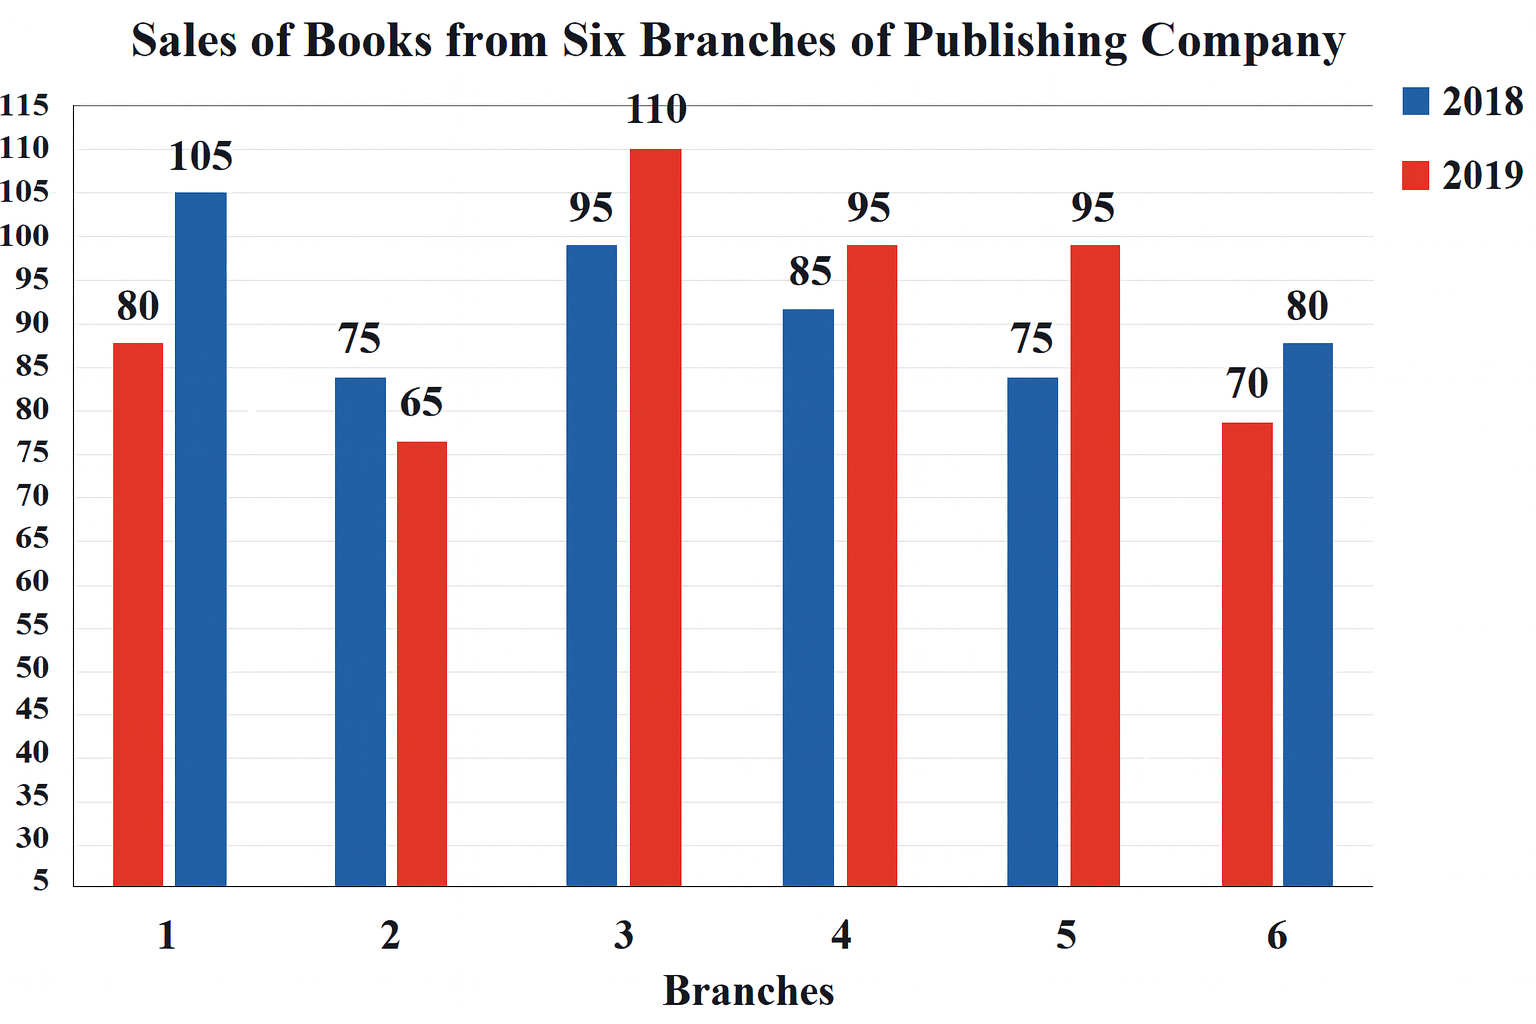
What is the average sales of all the branches (in thousands) for the year 2018?
The graph represents number of students who qualified in GATE, GMAT and CAT exams and those who qualified in none of these. (given that there are no students who passed two or more exams) 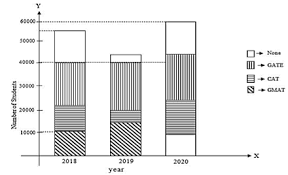
The percentage of students who qualified in at least one of the three exams in 2018 was:
The pie chart given below shows the number of television sold by 8 different companies. The total number of television sold by all these 8 companies is 21000. The number of television sold by a particular company is shown as a percent of total number of television sold by all these 8 companies.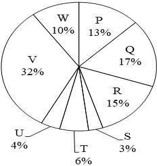
J1 = The value of average number of television sold by P and W
J2 = The value of average number of television sold by Q,R,S and V
What is the value of (J2 - J1)?
The length of the altitude of an equilateral triangle is 6\(\sqrt{3}\) m. The perimeter of the equilateral triangle (in m) is:
cos(30°+θ) - sin(60°-θ) = ?
\( \frac{\sqrt{3}}{2} \)
0
\( \frac{1}{2} \)
\( \frac{1}{\sqrt{2}} \)
A starts from a point at a speed of 34 m/s. After 5 seconds, B starts chasing A from the same point at a speed of 44 m/s. What will be the distance travelled by B before A is caught by B?
Find the value of the following expression.